Ionospheric variation during pulsating aurora (Hosokawa and Ogawa, JGR, 2015)2017.2.18
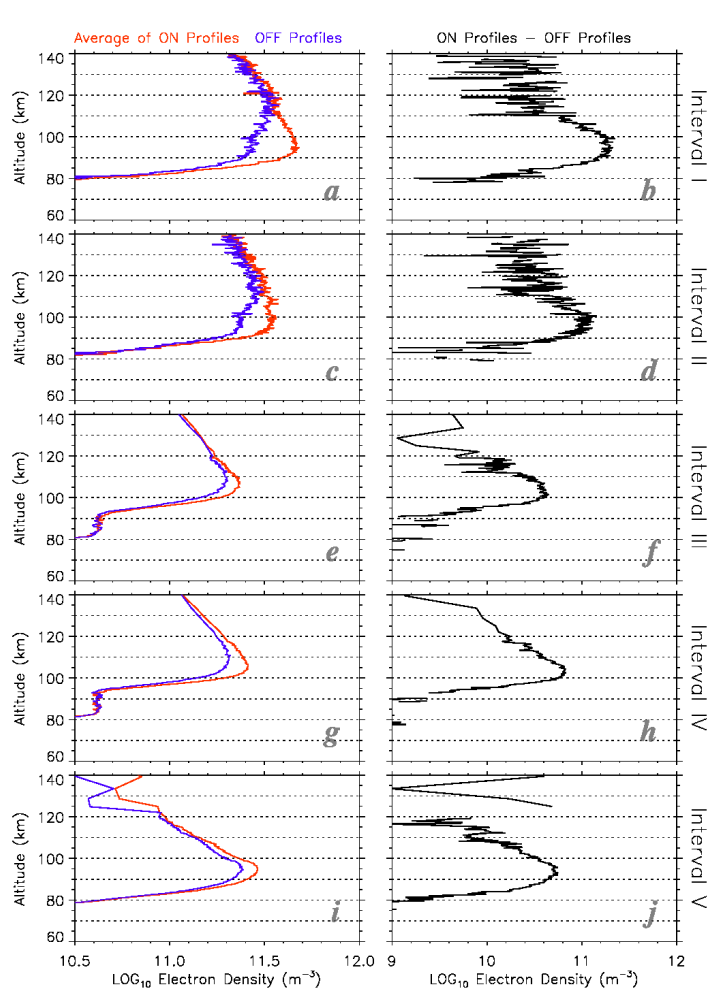
Figure : (Left) Altitude profile of the electron density during the ON (red) and OFF (blue) phases of Psa for Interval I to V, respectively. (Right) Difference between the ON and OFF profiles in the left panel, which corresponds to the true altitude profile of the electron density at the time of PsA.
We have statistically analyzed data from the European Incoherent Scatter (EISCAT) UHF/VHF radars in Tromsø (69.60°N, 19.20°E), Norway, to reveal how the occurrence of pulsating auroras (PsAs) modifies the electron density profile in the ionosphere. By checking five winter seasons' (2007–2012) observations of all-sky aurora cameras of the National Institute of Polar Research in Tromsø, we have extracted 21 cases of PsA. During these PsA events, either the UHF or VHF radar of EISCAT was operative and the electron density profiles were obtained along the field-aligned or vertical direction near the zenith. From these electron density measurements, we calculated hmE (E region peak height) and NmE (E region peak density), which are proxies for the energy and flux of the precipitating PsA electrons, respectively. Then, we examined how these two parameters changed during the evolution of 21 PsA events in a statistical fashion. The results can be summarized as follows: (1) hmE is lower (the energy of precipitation electrons is higher) during the periods of PsA than that in the surrounding interval; (2) when NmE is higher (flux of PsA electrons is larger), hmE tends to be lower (precipitation is harder); (3) hmE is lower and NmE is larger in the later magnetic local time; and (4) when the AE index during the preceding substorm is larger, hmE is lower and NmE is larger. These tendencies are discussed in terms of the characteristics of particles and plasma waves in the source of PsA in the magnetosphere. In addition to the statistics of the EISCAT data, we carried out several detailed case studies, in which the altitude profiles of the electron density were derived by separating the On and Off phases of PsA. This allows us to estimate the true altitude profiles of the PsA ionization, which can be used for estimating the characteristic energy of the PsA electrons and better understanding the wave-particle interaction process in the magnetosphere.
Hosokawa, K., and Y. Ogawa (2015), Ionospheric variation during pulsating aurora, J. Geophys. Res. Space Physics, 120, 5943–5957, doi:10.1002/2015JA021401.
カテゴリ:Aurora,Ionosphere
Approximate forms of daytime ionospheric conductance (Ieda et al., JGR, 2015)2017.2.18
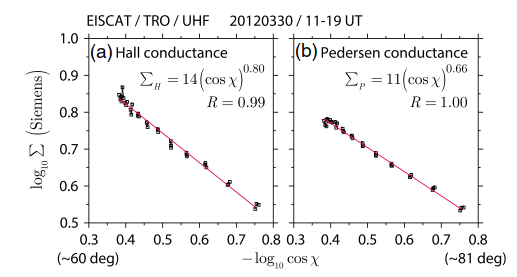
Figure: Solar zenith angle (
The solar zenith angle (SZA) dependence of the conductance is studied and a simple theoretical form for the Hall-to-Pedersen conductance ratio is developed, using the peak plasma production height. The European Incoherent Scatter (EISCAT) radar observations at Tromsø (67 MLAT) on 30 March 2012 were used to calculate the conductance. The daytime electric conductance is associated with plasma created by solar extreme ultraviolet radiation incident on the neutral atmosphere of the Earth. However, it has been uncertain whether previous conductance models are consistent with the ideal Chapman theory for such plasma productions. We found that the SZA dependence of the conductance is consistent with the Chapman theory after simple modifications. The Pedersen conductance can be understood by approximating the plasma density height profile as being flat in the topside E region and by taking into account the upward gradient of atmospheric temperature. An additional consideration is necessary for the Hall conductance, which decreases with increasing SZA more rapidly than the Pedersen conductance. This rapid decrease is presumably caused by a thinning of the Hall conductivity layer from noon toward nighttime. We expressed this thinning in terms of the peak production height in the Chapman theory.
Ieda, A., S. Oyama, H. Vanhamäki, R. Fujii, A. Nakamizo, O. Amm, T. Hori, M. Takeda, G. Ueno, A. Yoshikawa, R. J. Redmon, W. F. Denig, Y. Kamide, and N. Nishitani (2015), Approximate forms of daytime ionospheric conductance, J. Geophys. Res. Space Physics, 119, 10,397–10,415. doi:10.1002/2014JA020665.
カテゴリ:Currents,Ionosphere
Variations of the neutral temperature and sodium density between 80 and 107 km above Tromsoe during the winter of 2010-2011 by a new solid state sodium LIDAR (Nozawa et al., JGR, 2014)2017.2.18
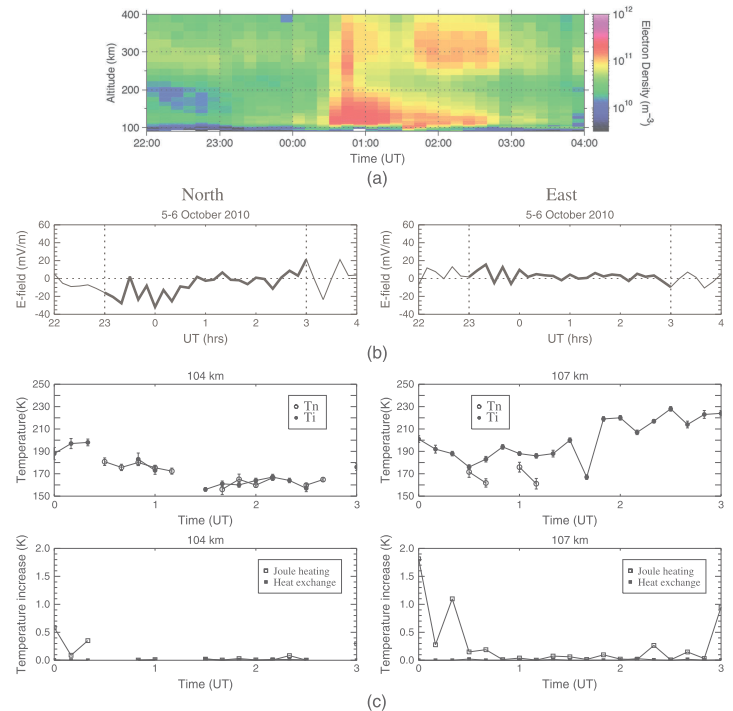
Figure: (a) Temporal and altitude variations of the electron density observed with the EISCAT UHF radar at Tromsø are shown from 2200 UT on 5 October to 0400 UT on 6 October 2010. (b) Temporal variations of the electric field of the (left) northward and (right) eastward components observed with the EISCAT UHF radar at Tromsø are shown from 2200 UT on 5 October to 0400 UT on 6 October 2010. Thicker lines denote the electric field values during the simultaneous observations with the sodium lidar. (c) Comparison of neutral (open circle: lidar) and ion (solid circle: EISCAT) temperatures (top left) at 104 km and (top right) at 107 km are shown from 0000 UT to 0300 UT on 6 October 2010. Vertical line associated with each symbol denotes its error value. Calculated temperature increase due to Joule heat (open square) and electron-ion heat exchange (solid square) derived by EISCAT data (bottom left) at 104 km and (bottom right) at 107 km are shown.
A new solid-state sodium lidar installed at Ramfjordmoen, Tromsø (69.6 N, 19.2 E), started observations of neutral temperature together with sodium density in the mesosphere-lower thermosphere (MLT) region on 1 October 2010. The new lidar provided temperature data with a time resolution of 10 min and with good quality between 80 and 105 km from October 2010 to March 2011. This paper aims at introducing the new lidar with its observational results obtained over the first 6 months of observations. We succeeded in obtaining neutral temperature and sodium density data of ~255.5 h in total. In order to evaluate our observations, we compared (1) the sodium density with that published in the literature, (2) average temperature and column sodium density data with those obtained with Arctic Lidar Observatory for Middle Atmosphere Research Weber sodium lidar, and (3) the neutral temperature data with those obtained by Sounding of the Atmosphere with Broadband Emission Radiometry/Thermosphere Ionosphere Mesosphere Energetics and Dynamics satellite. For the night of 5 October 2010, we succeeded in conducting simultaneous observations of the new lidar and the European Incoherent Scatter UHF radar with the tristatic Common Program 1 (CP-1) mode. Comparisons of neutral and ion temperatures showed a good agreement at 104 km between 0050 and 0230 UT on 6 October 2010 when the electric field strength was smaller, while significant deviations (up to 25 K) are found at 107 km. We evaluated contributions of Joule heating and electron-ion heat exchange, but derived values seem to be underestimated.
Nozawa, S., T. D. Kawahara, N. Saito, C. M. Hall, T. T. Tsuda, T. Kawabata, S. Wada, A. Brekke, T. Takahashi, H. Fujiwara, Y. Ogawa, and R. Fujii (2014), Variations of the neutral temperature and sodium density between 80 and 107 km above Tromsø during the winter of 2010–2011 by a new solid-state sodium lidar, J. Geophys. Res. Space Physics, 119, 441–451, doi:10.1002/2013JA019520.
カテゴリ:Atmosphere,Ionosphere
Height-dependent ionospheric variations in the vicinity of nightside poleward expanding aurora after substorm onset (Oyama et al., JGR, 2014)2017.2.18
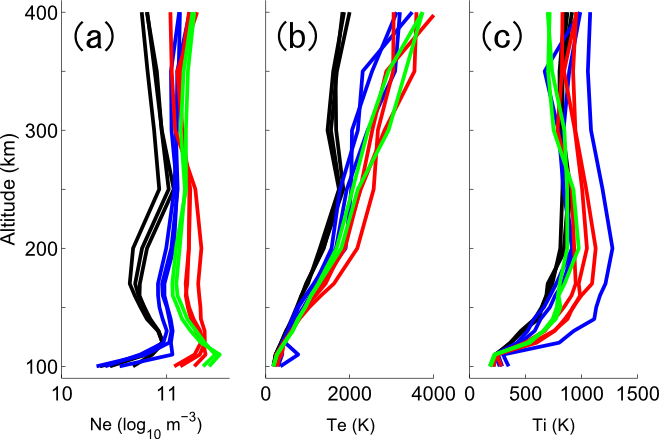
Figure: Height profile of (a) electron density, (b) electron temperature, and (c) ion temperature from the superposed epoch analysis of the EISCAT data. Time intervals are grouped by four colors (black: 60
High-latitude ionospheric variations at times near auroral substorms exhibit large temporal variations in both vertical and horizontal extents. Statistical analysis was made of data from the European Incoherent Scatter UHF radar at Tromsø, Norway, and International Monitor for Auroral Geomagnetic Effects magnetometer for finding common features in electron density, ion and electron temperatures and relating these to currents and associated heating. This paper particularly focused on the height dependencies. Results show clear evidences of large electric field with corresponding frictional heating and Pedersen currents located just outside the front of the poleward expanding aurora, which typically appeared at the eastside of westward traveling surge. At the beginning of the substorm recovery phase, the ionospheric density had a large peak in the E region and a smaller peak in the F region. This structure was named as C form in this paper based on its shape in the altitude-time plot. The lower altitude density maximum is associated with hard auroral electron precipitation probably during pulsating aurora. We attribute the upper F region density maximum to local ionization by lower energy particle precipitation and/or long-lived plasma that is convected horizontally into the overhead measurement volume from the dayside hemisphere.
Oyama, S., Y. Miyoshi, K. Shiokawa, J. Kurihara, T. T. Tsuda, and B. J. Watkins (2014), Height-dependent ionospheric variations in the vicinity of nightside poleward expanding aurora after substorm onset, J. Geophys. Res. Space Physics, 119, 4146–4156, doi:10.1002/2013JA019704.
カテゴリ:Aurora,Ionosphere
Seasonal variation and solar activity dependence of the quiet-time ionospheric trough (Ishida et al., JGR, 2014)2017.2.18
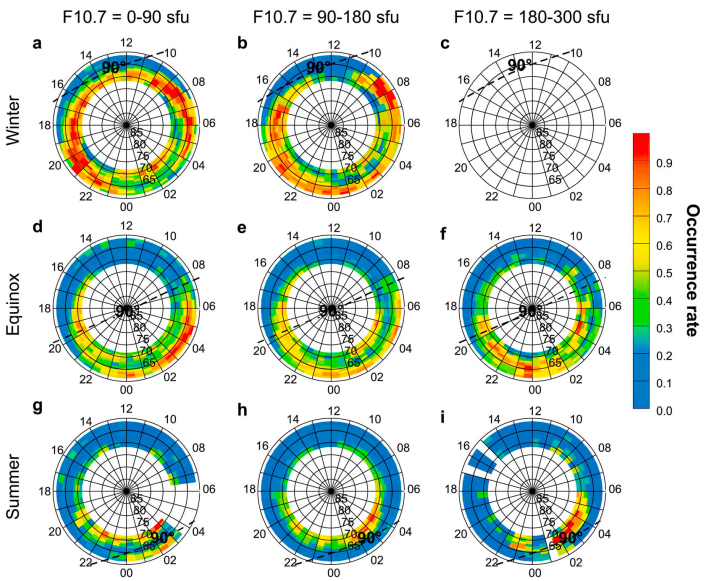
Figure: (a – i) The occurrence rate of the trough divided into three seasons and three solar activities. The black dashed line in each polar plot indicates the average solar terminator, where the solar zenith angle equals 90°.
A statistical analysis of the ionospheric F region trough have been conducted, focusing on its seasonal variation and solar activity dependence under geomagnetically quiet and moderate conditions, using plasma parameter data obtained via Common Program 3 observations performed by the European Incoherent Scatter (EISCAT) radar between 1982 and 2011. We have confirmed that there is a major difference in frictional heating between the high- and low-latitude sides of the EISCAT field of view (FOV) at ~73°0′N - 60°5′N (geomagnetic latitude) at an altitude of 325 km, which is associated with trough formation. The statistical results show that the high-latitude and mid-latitude troughs occur on the high- and low-latitude sides of the FOV, respectively. Seasonal variations indicate that dissociative recombination accompanied by frictional heating is a main cause of trough formation in sunlit regions. During summer, therefore, the occurrence rate is maintained at 80 - 90% in the post-midnight high-latitude region owing to frictional heating by eastward return flow. Solar activity dependence on trough formation indicates that field-aligned currents modulate the occurrence rate of the trough during the winter and equinox seasons. In addition, the trough becomes deeper via dissociative recombination caused by an increased ion temperature with F10.7, at least in the equinox and summer seasons but not in winter.
Ishida, T., Y. Ogawa, A. Kadokura, Y. Hiraki, and I. Häggström (2014), Seasonal variation and solar activity dependence of the quiet-time ionospheric trough, J. Geophys. Res. Space Physics, 119, 6774–6783, doi:10.1002/2014JA019996.
カテゴリ:Ionosphere,Trough