Research Highlight

Low-Altitude Ion Upflow Observed by EISCAT and its Effects on Supply of Molecular Ions in the Ring Current Detected by Arase (ERG) (Takada et al., 2021)May 20, 2021

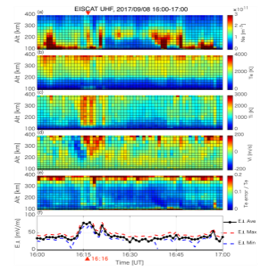
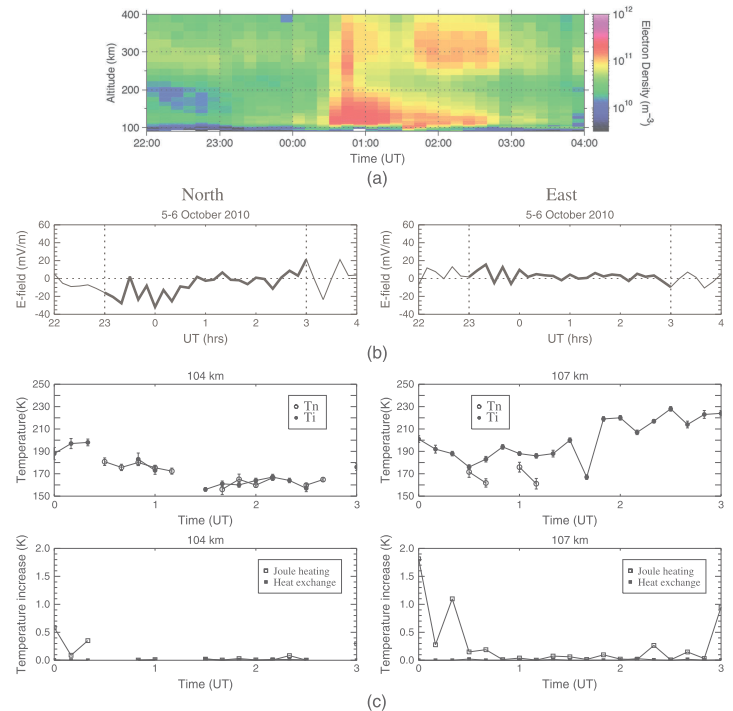
EISCAT observations during 16-17 UT on September 8, 2017. From top to bottom, each panel shows (a) electron density, (b) electron temperature, (c) ion temperature, (d) ion velocity, (e) error ratio of electron temperature, and (f) electric field perpendicular to the magnetic field derived from electron heating at 111 km altitude based on empirical relations reported by a previous statistical study (Davies & Robinson, 1997).

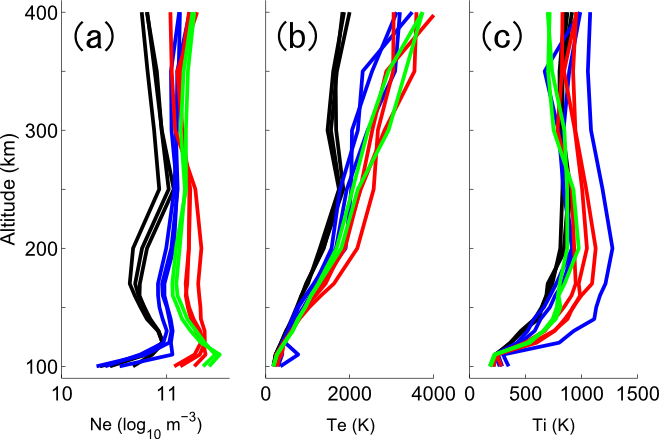
During the magnetic storm starting on September 7, 2017, the MEP-i instrument onboard the Arase (ERG) satellite observed molecular ions (O2+/NO+/N2+) in the ring current. The molecular ions were observed by Arase in four orbits during this magnetic storm. This indicates that there was a continuous molecular ion supply from the ionosphere. During the storm main phase around the second Dst minimum (100 nT) on September 8, 2017, the European Incoherent Scatter (EISCAT) radar observed the ion upflow (50-150 m s-1) in the low-altitude (250-350 km) ionosphere together with strong ion heating up to >2,000 K. The convective electric field derived from the electron heating observed by EISCAT at an altitude of approximately 110 km was also enhanced by a factor of 2. The observations suggest that the additional ion heating at low altitudes helps to cause the fast upflow and transport molecular ions upward. The flux decreases from 280 to 350 km altitudes due to the dissociative recombination was estimated to be approximately two orders of magnitude. This resulted in significant molecular ion flux remaining at 350 km altitude. These results suggest that the low-altitude ion upflow caused by the ion frictional heating enables molecular ions to escape to space against rapid loss by the dissociative recombination.

Takada et al., Low-altitude ion upflow observed by EISCAT and its effects on supply of molecular ions in the ring current detected by Arase (ERG), JGR, doi:10.1029/2020JA028951, 2021.

Categories: Outflow


Auroral molecular-emission effects on the atomic oxygen line at 777.4 nm (Oyama et al., 2018)May 20, 2021

a) Height profiles of the EISCAT-measured electron density at 18:31:30 UT (blue) and 18:33:30 UT (orange) on March 2, 2017. Measurement uncertainty of +/-1s is marked by a horizontal bar in each color. b) An image of the Tromsoe all-sky camera, which was taken at 18:33:50 UT. The direction of the EISCAT radar and spectrograph measurements is marked by a yellow circle. Five faint lines from the northern edge represent contaminations of a sodium lidar. c) Spectrum measured at 18:33:29 UT on March 2, 2017, at wavelength of 750-800 nm. A vertical dashed line is marked at 777.4 nm

One of the representative auroral emission lines that radiates from F-region heights and is measurable on the ground is the 777.4 nm line from excited atomic oxygen. This line has been adopted, along with another E-region emission line, for example 427.8 nm, to estimate the mean energy and total energy flux of precipitating auroral electrons. The influence of emissions from part of the molecular nitrogen band, which mainly radiate from E-region heights, should be carefully evaluated because it might overlap the 777.4 nm atomic oxygen line in the spectrum. We performed statistical analysis of auroral spectrograph measurements that were obtained during the winter of 2016-2017 in Tromsoe, Norway, to derive the ratio of the intensity of the 777.4 nm atomic oxygen line to that of the net measurement through a typically used optical filter with a full width at half maximum of a few nm. The ratio had a negative trend against geomagnetic activity, with a primary distribution of 0.5-0.7 and a minimum value of 0.3 for the most active auroral condition in this study. This result suggests that the 30-50% emission intensities measured through the optical filter may be from the molecular nitrogen band.

Oyama, S., T. T. Tsuda, K. Hosokawa, Y. Ogawa, Y. Miyoshi, S. Kurita, A. E. Kero, R. Fujii, Y. Tanaka, A. Mizuno, T. Kawabata, B. Gustavsson, and T. Leyser, Auroral molecular-emission effects on the atomic oxygen line at 777.4 nm, Earth Planets Space, 70, 166, doi:10.1186/s40623-018-0936-z, 2018.

Categories: Aurora


Survey of conditions for artificial aurora experiments at EISCAT Tromsoe using dynasonde data (Tsuda et al., 2018)May 20, 2021

(upper) Year-to-year variation in the occurrence rate of possible days for conducting artificial aurora experiments from 2000 to 2017. The red indicates results in the case of 2.7-MHz frequency, and the black indicates results in the case of 4-MHz frequency. (lower) Year-to-year variation in 1-year-averaged F10.7 from 2000 to 2017

We report a brief survey of matching conditions for artificial aurora optical experiments utilizing the second electron gyro-harmonic (2.7-MHz frequency) in F region heating with O-mode at the EISCAT Tromsoe site using dynasonde data from 2000 to 2017. Our survey indicates the following: The possible conditions for successful artificial aurora experiments are concentrated on twilight hours in both evening and morning, compared with late night hours; the possible conditions appear in fall, winter, and spring, while there is no chance in summer, and the month-to-month variation among fall, winter, and spring is not so clear; the year-to-year variation is well correlated with the solar activity. These characteristics in the case of 2.7-MHz frequency are basically similar to those previously reported in the case of 4-MHz frequency. However, the number of days meeting the possible condition in the case of 2.7-MHz frequency is obviously large, compared with that in the case of 4-MHz frequency. In particular, unlike the 4-MHz frequency operation, the 2.7-MHz frequency operation can provide many chances for successful artificial aurora experiments even during the solar minimum.

Tsuda, T. T., M. T. Rietveld, M. J. Kosch, S. Oyama, Y. Ogawa, K. Hosokawa, S. Nozawa, T. Kawabata, and A. Mizuno, Survey of conditions for artificial aurora experiments by the second electron gyro-harmonic at EISCAT Tromsoe using dynasonde data, Earth Planets Space, 70, 94, doi:10.1186/s40623-018-0864-y, 2018. Tsuda, T. T., M. T. Rietveld, M. J. Kosch, S. Oyama, K. Hosokawa, S. Nozawa, T. Kawabata, A. Mizuno, and Y. Ogawa, Survey of conditions for artificial aurora experiments at EISCAT Tromsoe using dynasonde data, Earth Planets Space, 70, 40, doi:10.1186/s40623-018-0805-9, 2018.

Categories: Aurora


Energetic electron precipitation and auroral morphology at the substorm recovery phase (Oyama et al., JGR, 2017)Jul 16, 2017

(a) Electron density measured with the EISCAT VHF radar at 60-110 km height for 24 h from 15 UT in 22 January 2014. Black dots present a height where the electron density peaks during each integration period (1 min). Purple dots present CNA (dB) estimated from the EISCAT-measured electron density (a horizontal line of 60 km height corresponds to 0 dB for the CNA. Scale of 1 dB is marked in the figure). (b) Keogram made of an all-sky camera images taken from 15 to 07 UT in 22-23 January 2014 at the Tromso EISCAT radar site, which is marked by a horizontal red line. Three time intervals focused in this study are highlighted by yellow boxes and arrows at the top of Figure 1a.

It is well known that auroral patterns at the substorm recovery phase are characterized by diffuse or patch structures with intensity pulsation. According to satellite measurements and simulation studies, the precipitating electrons associated with these aurorae can reach or exceed energies of a few hundreds of keV through resonant wave-particle interactions in the magnetosphere. However, because of difficulty of simultaneous measurements, the dependency of energetic electron precipitation (EEP) on auroral morphological changes in the mesoscale has not been investigated to date. In order to study this dependency, we have analyzed data from the European Incoherent Scatter (EISCAT) radar, the Kilpisjärvi Atmospheric Imaging Receiver Array (KAIRA) riometer, collocated cameras, ground-based magnetometers, the Van Allen Probe satellites, Polar Operational Environmental Satellites (POES), and the Antarctic-Arctic Radiation-belt (Dynamic) Deposition-VLF Atmospheric Research Konsortium (AARDDVARK). Here we undertake a detailed examination of two case studies. The selected two events suggest that the highest energy of EEP on those days occurred with auroral patch formation from postmidnight to dawn, coinciding with the substorm onset at local midnight. Measurements of the EISCAT radar showed ionization as low as 65 km altitude, corresponding to EEP with energies of about 500 keV.

Oyama, S., A. Kero, C. J. Rodger, M. A. Clilverd, Y. Miyoshi, N. Partamies, E. Turunen, T. Raita, P. T. Verronen, and S. Saito (2017), Energetic electron precipitation and auroral morphology at the substorm recovery phase, J. Geophys. Res. Space Physics, 122, doi:10.1002/2016JA023484.

Categories: M-I Coupling


Ionospheric variation during pulsating aurora (Hosokawa and Ogawa, JGR, 2015)Feb 18, 2017

Figure : (Left) Altitude profile of the electron density during the ON (red) and OFF (blue) phases of Psa for Interval I to V, respectively. (Right) Difference between the ON and OFF profiles in the left panel, which corresponds to the true altitude profile of the electron density at the time of PsA.

We have statistically analyzed data from the European Incoherent Scatter (EISCAT) UHF/VHF radars in Tromsø (69.60°N, 19.20°E), Norway, to reveal how the occurrence of pulsating auroras (PsAs) modifies the electron density profile in the ionosphere. By checking five winter seasons' (2007–2012) observations of all-sky aurora cameras of the National Institute of Polar Research in Tromsø, we have extracted 21 cases of PsA. During these PsA events, either the UHF or VHF radar of EISCAT was operative and the electron density profiles were obtained along the field-aligned or vertical direction near the zenith. From these electron density measurements, we calculated hmE (E region peak height) and NmE (E region peak density), which are proxies for the energy and flux of the precipitating PsA electrons, respectively. Then, we examined how these two parameters changed during the evolution of 21 PsA events in a statistical fashion. The results can be summarized as follows: (1) hmE is lower (the energy of precipitation electrons is higher) during the periods of PsA than that in the surrounding interval; (2) when NmE is higher (flux of PsA electrons is larger), hmE tends to be lower (precipitation is harder); (3) hmE is lower and NmE is larger in the later magnetic local time; and (4) when the AE index during the preceding substorm is larger, hmE is lower and NmE is larger. These tendencies are discussed in terms of the characteristics of particles and plasma waves in the source of PsA in the magnetosphere. In addition to the statistics of the EISCAT data, we carried out several detailed case studies, in which the altitude profiles of the electron density were derived by separating the On and Off phases of PsA. This allows us to estimate the true altitude profiles of the PsA ionization, which can be used for estimating the characteristic energy of the PsA electrons and better understanding the wave-particle interaction process in the magnetosphere.

Hosokawa, K., and Y. Ogawa (2015), Ionospheric variation during pulsating aurora, J. Geophys. Res. Space Physics, 120, 5943–5957, doi:10.1002/2015JA021401.

Categories: Aurora,Ionosphere


Energetic electron precipitation associated with pulsating aurora: EISCAT and Van Allen Probe observations (Miyoshi et al., JGR, 2015)Feb 18, 2017

Figure 8. (a) Frequency-time diagram of the LBC waves used in the GEMSIS-RBW simulation. (b) Energy spectrum at the magnetosphere observed by the Van Allen Probe-A satellite (blue triangle), at the ionosphere altitude estimated by the CARD inversion method using the EISCAT observation data (red triangle). Purple hexagons indicate the precipitated flux simulated by GEMSIS-RBW.

Pulsating auroras show quasi-periodic intensity modulations caused by the precipitation of energetic electrons of the order of tens of keV. It is expected theoretically that not only these electrons but also subrelativistic/relativistic electrons precipitate simultaneously into the ionosphere owing to whistler mode wave-particle interactions. The height-resolved electron density profile was observed with the European Incoherent Scatter (EISCAT) Tromsø VHF radar on 17 November 2012. Electron density enhancements were clearly identified at altitudes >68 km in association with the pulsating aurora, suggesting precipitation of electrons with a broadband energy range from ~10 keV up to at least 200 keV. The riometer and network of subionospheric radio wave observations also showed the energetic electron precipitations during this period. During this period, the footprint of the Van Allen Probe-A satellite was very close to Tromsø and the satellite observed rising tone emissions of the lower band chorus (LBC) waves near the equatorial plane. Considering the observed LBC waves and electrons, we conducted a computer simulation of the wave-particle interactions. This showed simultaneous precipitation of electrons at both tens of keV and a few hundred keV, which is consistent with the energy spectrum estimated by the inversion method using the EISCAT observations. This result revealed that electrons with a wide energy range simultaneously precipitate into the ionosphere in association with the pulsating aurora, providing the evidence that pulsating auroras are caused by whistler chorus waves. We suggest that scattering by propagating whistler simultaneously causes both the precipitations of subrelativistic electrons and the pulsating aurora.

Miyoshi, Y., S. Oyama, S. Saito, S. Kurita, H. Fujiwara, R. Kataoka, Y. Ebihara, C. Kletzing, G. Reeves, O. Santolik, M. Clilverd, C. J. Rodger, E. Turunen, and F. Tsuchiya (2015), Energetic electron precipitation associated with pulsating aurora: EISCAT and Van Allen Probe observations. J. Geophys. Res. Space Physics, 120, 2754–2766, doi: 10.1002/2014JA020690.

Categories: Aurora,M-I Coupling


Approximate forms of daytime ionospheric conductance (Ieda et al., JGR, 2015)Feb 18, 2017

Figure: Solar zenith angle (

The solar zenith angle (SZA) dependence of the conductance is studied and a simple theoretical form for the Hall-to-Pedersen conductance ratio is developed, using the peak plasma production height. The European Incoherent Scatter (EISCAT) radar observations at Tromsø (67 MLAT) on 30 March 2012 were used to calculate the conductance. The daytime electric conductance is associated with plasma created by solar extreme ultraviolet radiation incident on the neutral atmosphere of the Earth. However, it has been uncertain whether previous conductance models are consistent with the ideal Chapman theory for such plasma productions. We found that the SZA dependence of the conductance is consistent with the Chapman theory after simple modifications. The Pedersen conductance can be understood by approximating the plasma density height profile as being flat in the topside E region and by taking into account the upward gradient of atmospheric temperature. An additional consideration is necessary for the Hall conductance, which decreases with increasing SZA more rapidly than the Pedersen conductance. This rapid decrease is presumably caused by a thinning of the Hall conductivity layer from noon toward nighttime. We expressed this thinning in terms of the peak production height in the Chapman theory.

Ieda, A., S. Oyama, H. Vanhamäki, R. Fujii, A. Nakamizo, O. Amm, T. Hori, M. Takeda, G. Ueno, A. Yoshikawa, R. J. Redmon, W. F. Denig, Y. Kamide, and N. Nishitani (2015), Approximate forms of daytime ionospheric conductance, J. Geophys. Res. Space Physics, 119, 10,397–10,415. doi:10.1002/2014JA020665.

Categories: Currents,Ionosphere


Upper atmosphere cooling over the past 33 years (Ogawa et al., GRL, 2014)Feb 18, 2017

Figure: The residual ion temperature at 310-340 km altitude after removal of the solar effects (in red) and a linear fit to it (in blue).

Theoretical models and observations have suggested that the increasing greenhouse gas concentration in the troposphere causes the upper atmosphere to cool and contract. However, our understanding of the long-term trends in the upper atmosphere is still quite incomplete, due to a limited amount of available and well-calibrated data. The European Incoherent Scatter (EISCAT) radar has gathered data in the polar ionosphere above Tromsø for over 33 years. Using this long-term data set, we have estimated the first significant trends of ion temperature at altitudes between 200 and 450 km. The estimated trends indicate a cooling of 10-15 K/decade near the F region peak (220-380 km altitude), whereas above 400 km the trend is nearly zero or even warming. The height profiles of the observed trends are close to those predicted by recent atmospheric general circulation models. Our results are the first quantitative confirmation of the simulations and of the qualitative expectations.

Ogawa, Y., T. Motoba, S. C. Buchert, I. Häggström, and S. Nozawa (2014), Upper atmosphere cooling over the past 33 years, Geophys. Res. Lett., 41, 5629–5635, doi:10.1002/2014GL060591.

Categories: Atmosphere,Long Term


Variations of the neutral temperature and sodium density between 80 and 107 km above Tromsoe during the winter of 2010-2011 by a new solid state sodium LIDAR (Nozawa et al., JGR, 2014)Feb 18, 2017

Figure: (a) Temporal and altitude variations of the electron density observed with the EISCAT UHF radar at Tromsø are shown from 2200 UT on 5 October to 0400 UT on 6 October 2010. (b) Temporal variations of the electric field of the (left) northward and (right) eastward components observed with the EISCAT UHF radar at Tromsø are shown from 2200 UT on 5 October to 0400 UT on 6 October 2010. Thicker lines denote the electric field values during the simultaneous observations with the sodium lidar. (c) Comparison of neutral (open circle: lidar) and ion (solid circle: EISCAT) temperatures (top left) at 104 km and (top right) at 107 km are shown from 0000 UT to 0300 UT on 6 October 2010. Vertical line associated with each symbol denotes its error value. Calculated temperature increase due to Joule heat (open square) and electron-ion heat exchange (solid square) derived by EISCAT data (bottom left) at 104 km and (bottom right) at 107 km are shown.

A new solid-state sodium lidar installed at Ramfjordmoen, Tromsø (69.6 N, 19.2 E), started observations of neutral temperature together with sodium density in the mesosphere-lower thermosphere (MLT) region on 1 October 2010. The new lidar provided temperature data with a time resolution of 10 min and with good quality between 80 and 105 km from October 2010 to March 2011. This paper aims at introducing the new lidar with its observational results obtained over the first 6 months of observations. We succeeded in obtaining neutral temperature and sodium density data of ~255.5 h in total. In order to evaluate our observations, we compared (1) the sodium density with that published in the literature, (2) average temperature and column sodium density data with those obtained with Arctic Lidar Observatory for Middle Atmosphere Research Weber sodium lidar, and (3) the neutral temperature data with those obtained by Sounding of the Atmosphere with Broadband Emission Radiometry/Thermosphere Ionosphere Mesosphere Energetics and Dynamics satellite. For the night of 5 October 2010, we succeeded in conducting simultaneous observations of the new lidar and the European Incoherent Scatter UHF radar with the tristatic Common Program 1 (CP-1) mode. Comparisons of neutral and ion temperatures showed a good agreement at 104 km between 0050 and 0230 UT on 6 October 2010 when the electric field strength was smaller, while significant deviations (up to 25 K) are found at 107 km. We evaluated contributions of Joule heating and electron-ion heat exchange, but derived values seem to be underestimated.

Nozawa, S., T. D. Kawahara, N. Saito, C. M. Hall, T. T. Tsuda, T. Kawabata, S. Wada, A. Brekke, T. Takahashi, H. Fujiwara, Y. Ogawa, and R. Fujii (2014), Variations of the neutral temperature and sodium density between 80 and 107 km above Tromsø during the winter of 2010–2011 by a new solid-state sodium lidar, J. Geophys. Res. Space Physics, 119, 441–451, doi:10.1002/2013JA019520.

Categories: Atmosphere,Ionosphere


Height-dependent ionospheric variations in the vicinity of nightside poleward expanding aurora after substorm onset (Oyama et al., JGR, 2014)Feb 18, 2017

Figure: Height profile of (a) electron density, (b) electron temperature, and (c) ion temperature from the superposed epoch analysis of the EISCAT data. Time intervals are grouped by four colors (black: 60

High-latitude ionospheric variations at times near auroral substorms exhibit large temporal variations in both vertical and horizontal extents. Statistical analysis was made of data from the European Incoherent Scatter UHF radar at Tromsø, Norway, and International Monitor for Auroral Geomagnetic Effects magnetometer for finding common features in electron density, ion and electron temperatures and relating these to currents and associated heating. This paper particularly focused on the height dependencies. Results show clear evidences of large electric field with corresponding frictional heating and Pedersen currents located just outside the front of the poleward expanding aurora, which typically appeared at the eastside of westward traveling surge. At the beginning of the substorm recovery phase, the ionospheric density had a large peak in the E region and a smaller peak in the F region. This structure was named as C form in this paper based on its shape in the altitude-time plot. The lower altitude density maximum is associated with hard auroral electron precipitation probably during pulsating aurora. We attribute the upper F region density maximum to local ionization by lower energy particle precipitation and/or long-lived plasma that is convected horizontally into the overhead measurement volume from the dayside hemisphere.

Oyama, S., Y. Miyoshi, K. Shiokawa, J. Kurihara, T. T. Tsuda, and B. J. Watkins (2014), Height-dependent ionospheric variations in the vicinity of nightside poleward expanding aurora after substorm onset, J. Geophys. Res. Space Physics, 119, 4146–4156, doi:10.1002/2013JA019704.

Categories: Aurora,Ionosphere


© 2017 EISCAT Japan