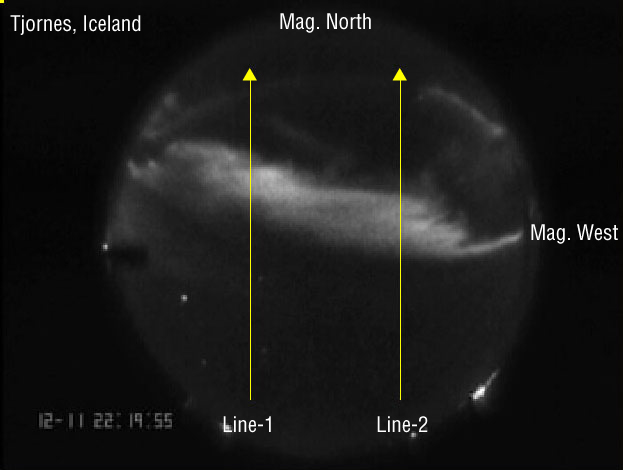
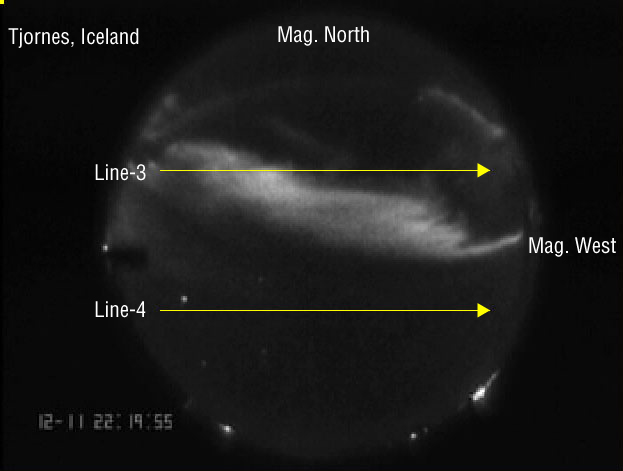
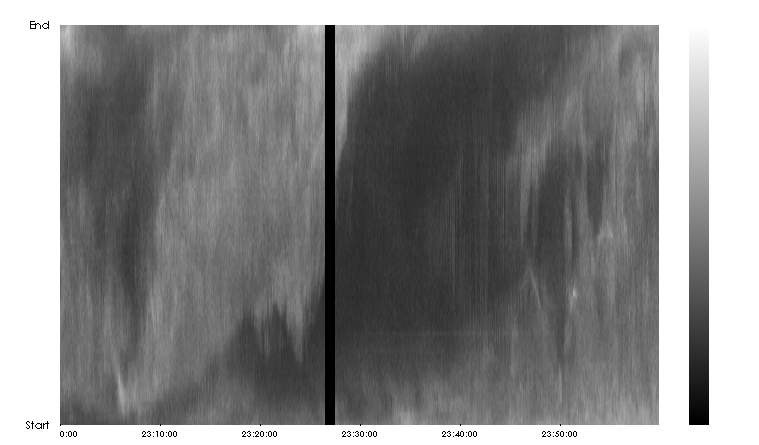
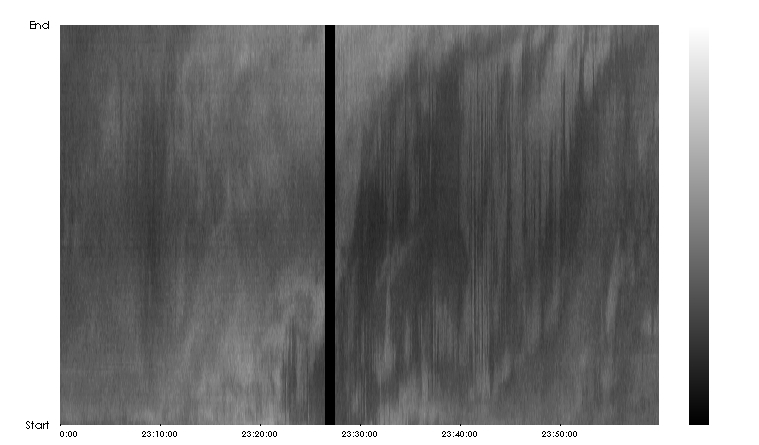
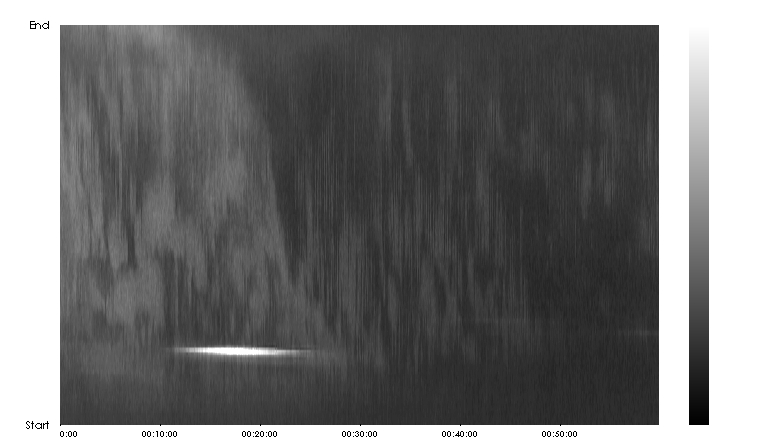
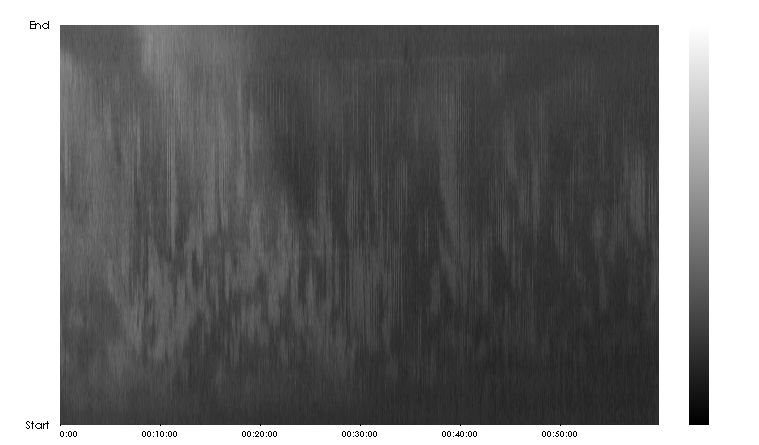
Optical aurora observed by all-sky TV camera at Tjornes in Iceland during December 2001.
Organization for this project:
1) National Institute of Polar Research (PI: Prof. Natsuo Sato)
2) Science Institute, University of Iceland (PI: Prof. Thorsteinn Saemundsson)
Observatory name and coordinates:
Name: Tjornes in Iceland
Geographic Coordinates: 66°11'55"N 17°05'57"W
Geomagnetic Coordinates: 66.9 S, 73.3
Instrumentation:
High sensitive all-sky TV camera recorded by NTSC digital video recorders (original data are recorded by 30 frames/sec)
Data items and data period:
Items: Keograms
Period: 8 nights from 11 December 2001 to 18 December 2001
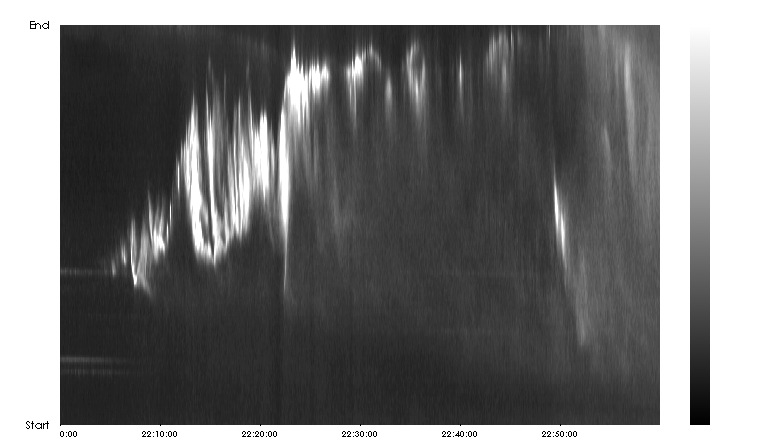
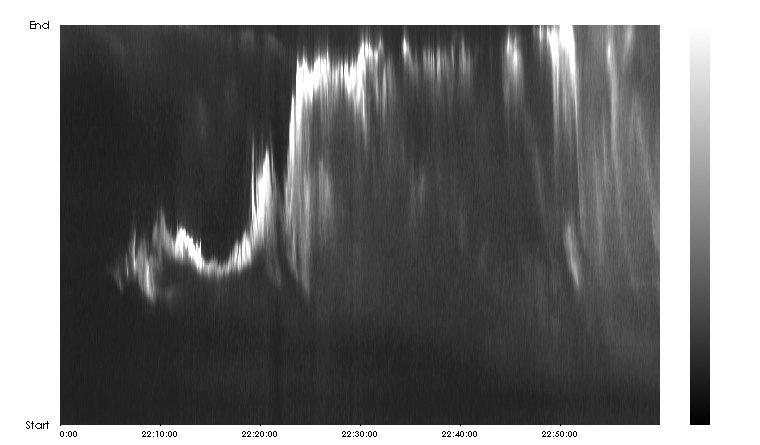
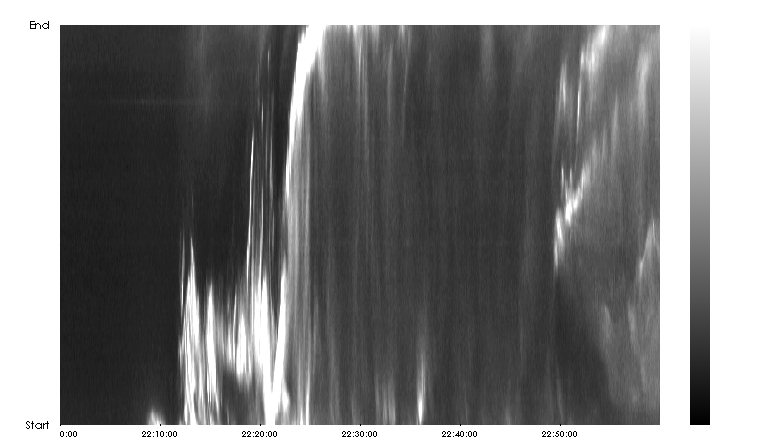
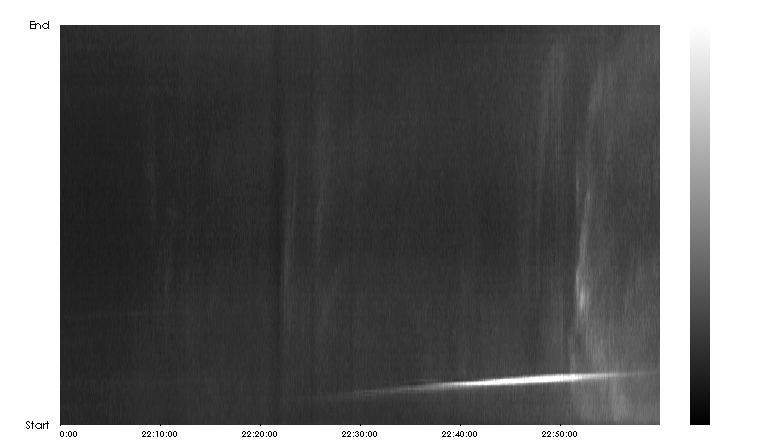
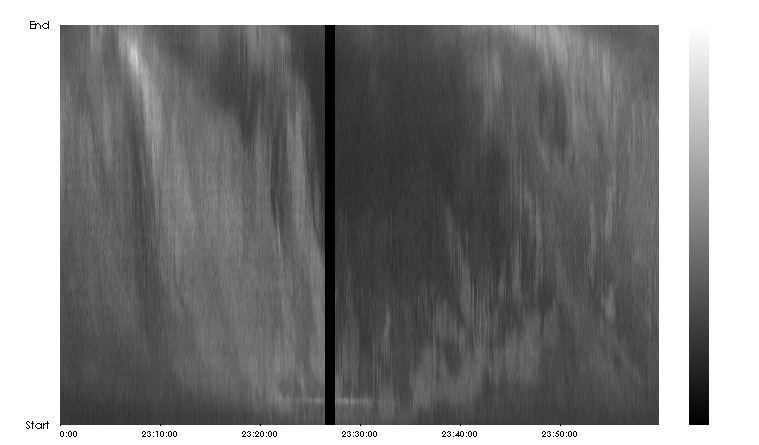
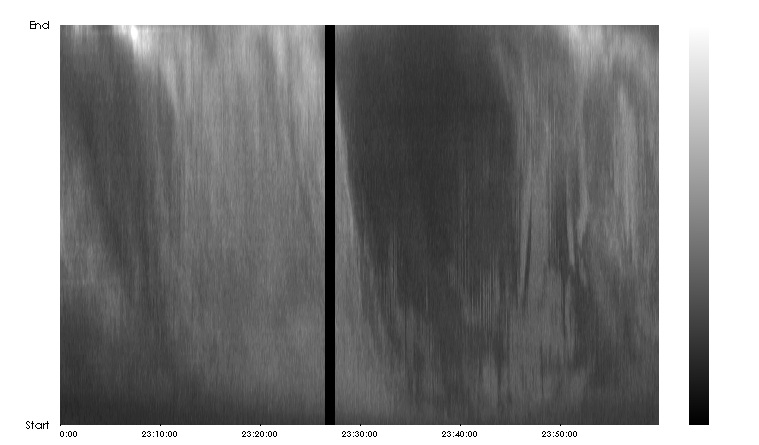
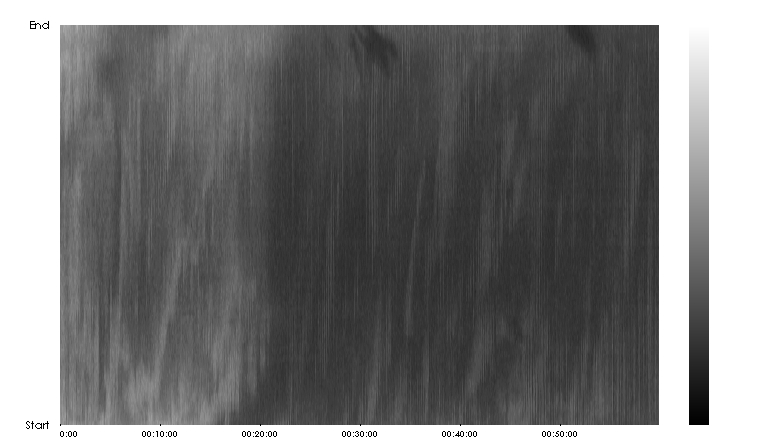
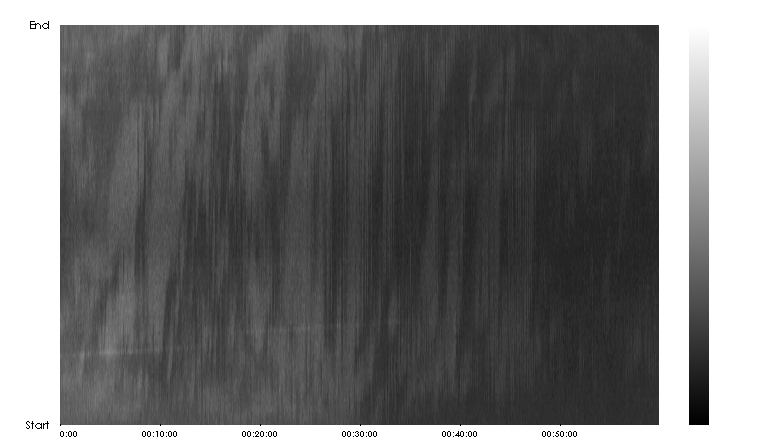
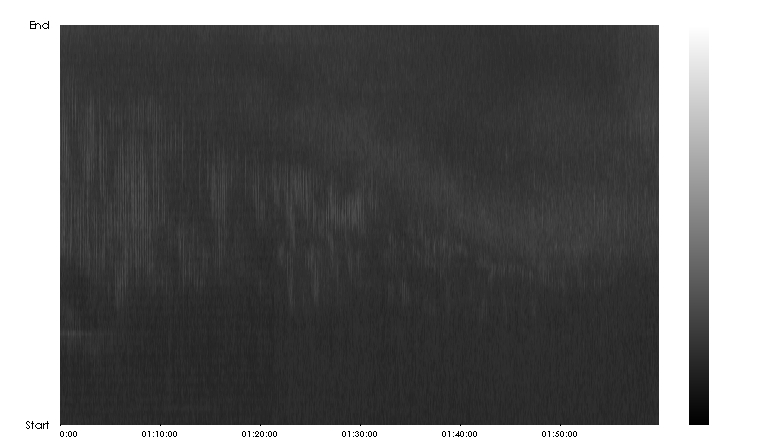
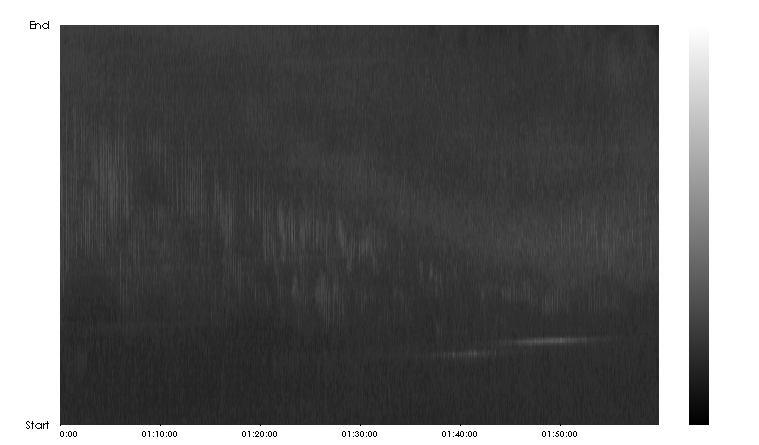
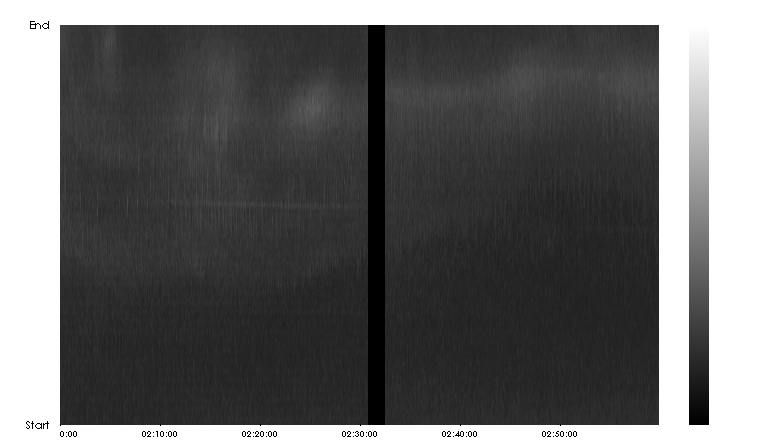
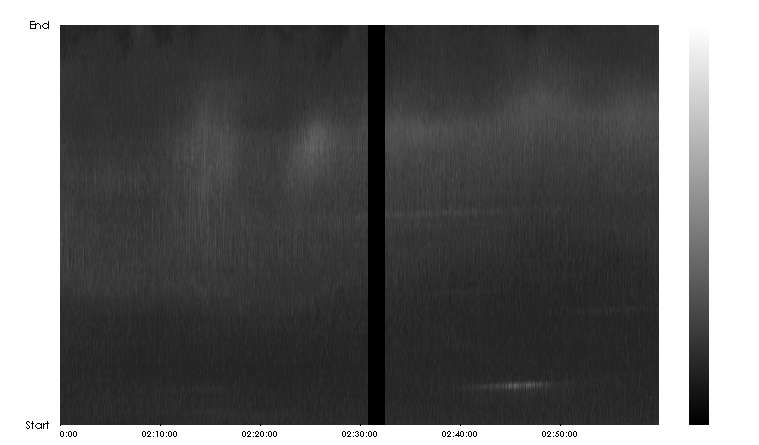
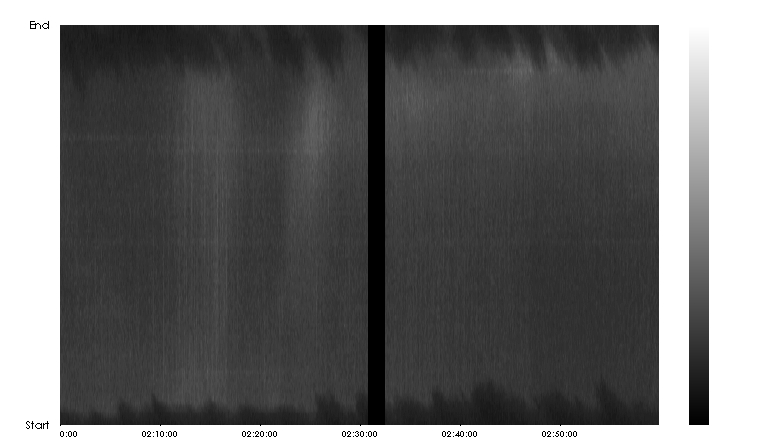
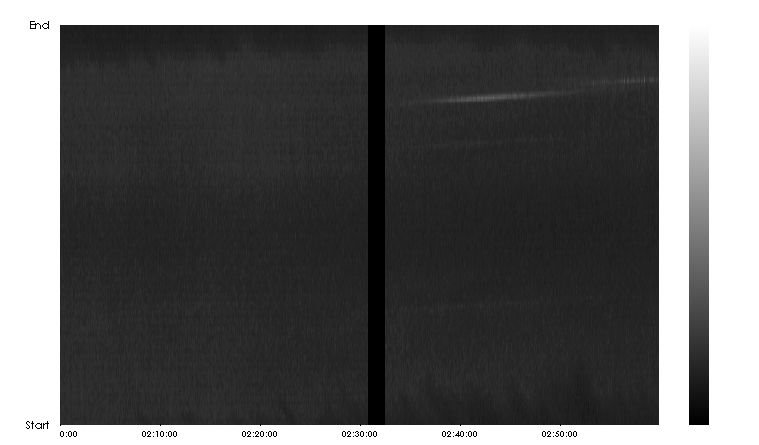
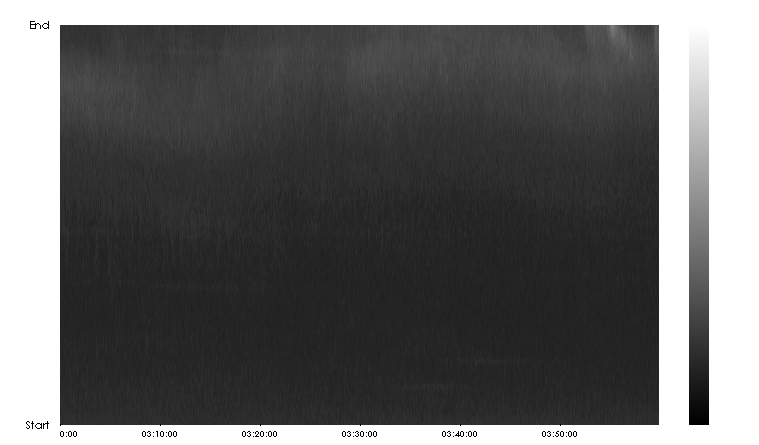
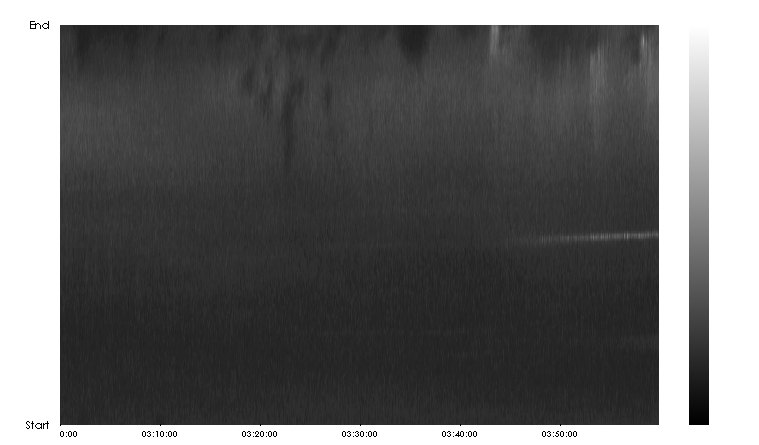
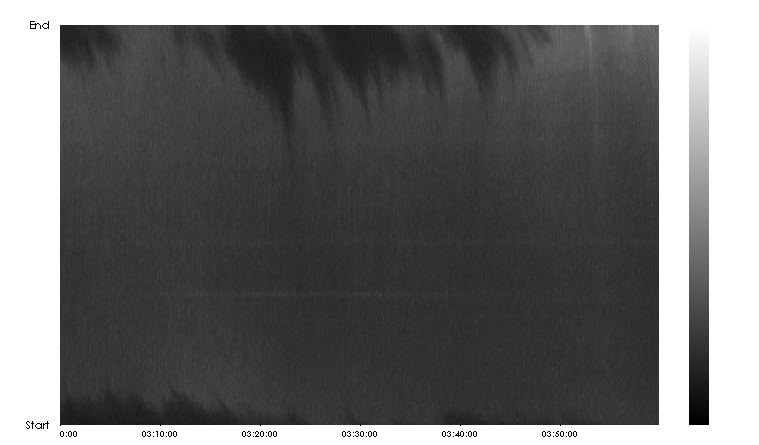
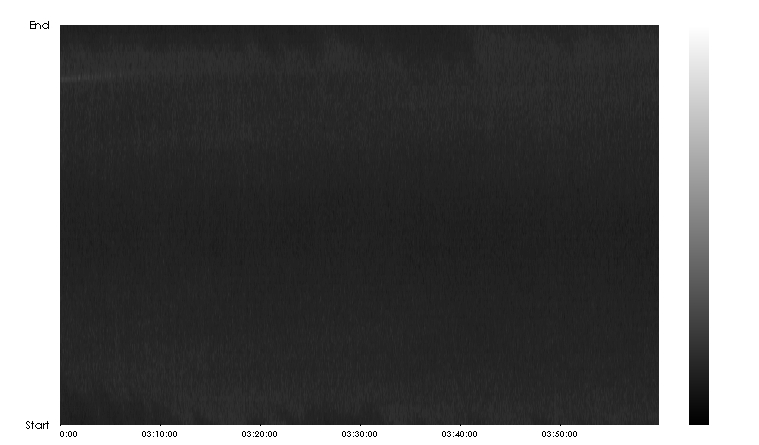
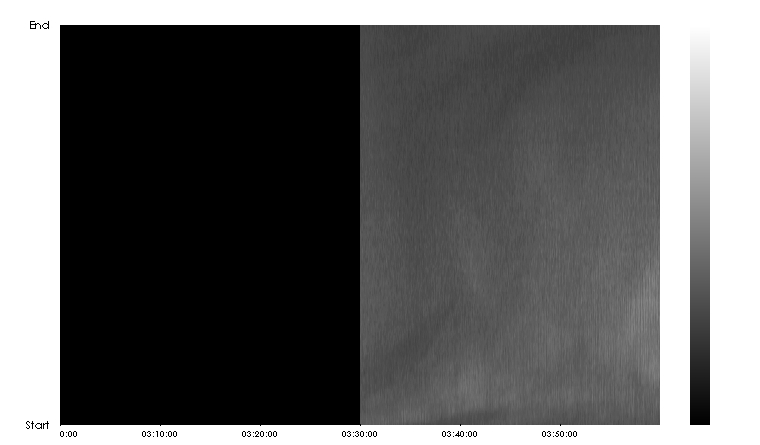
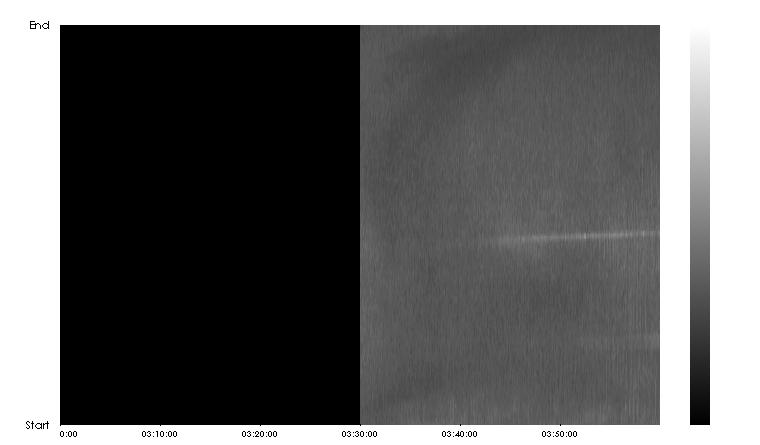
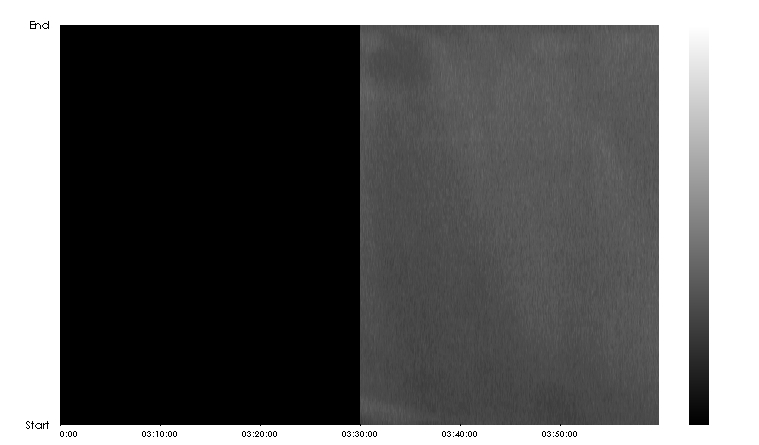
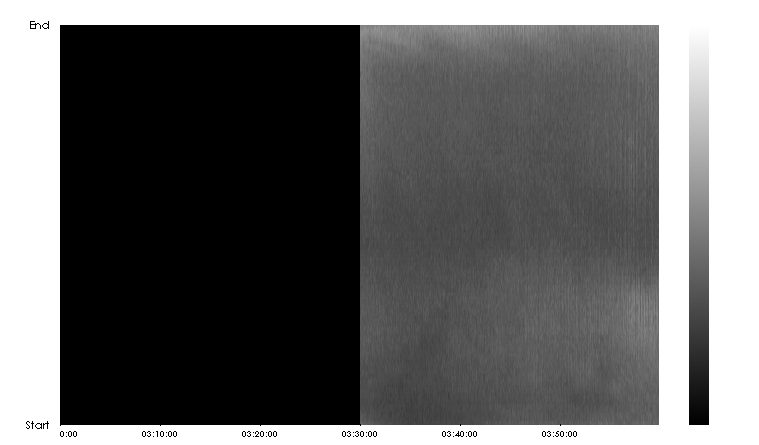
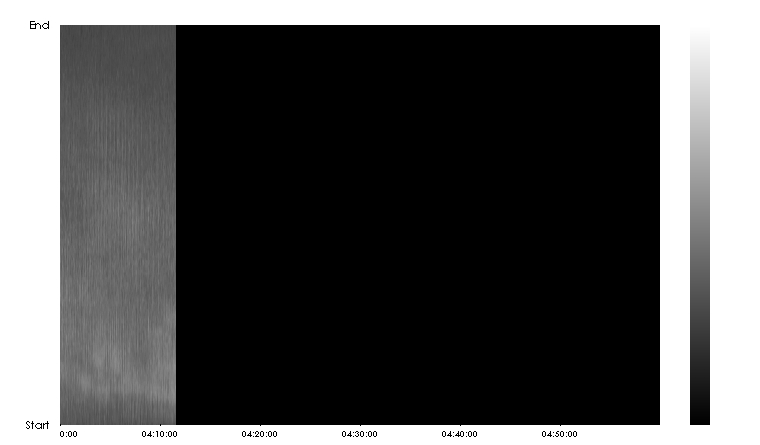
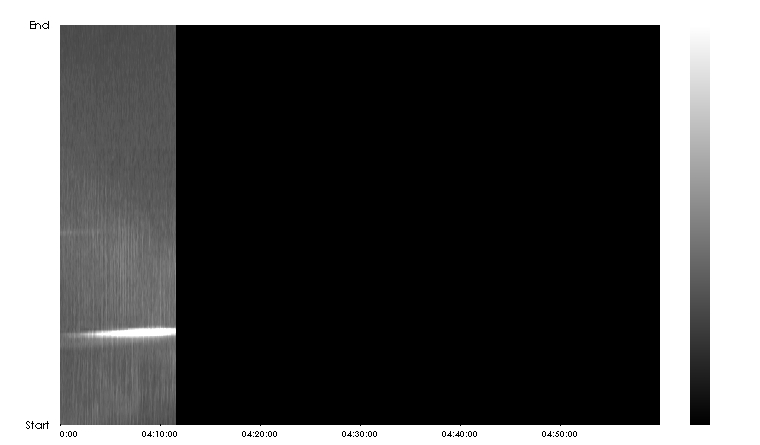
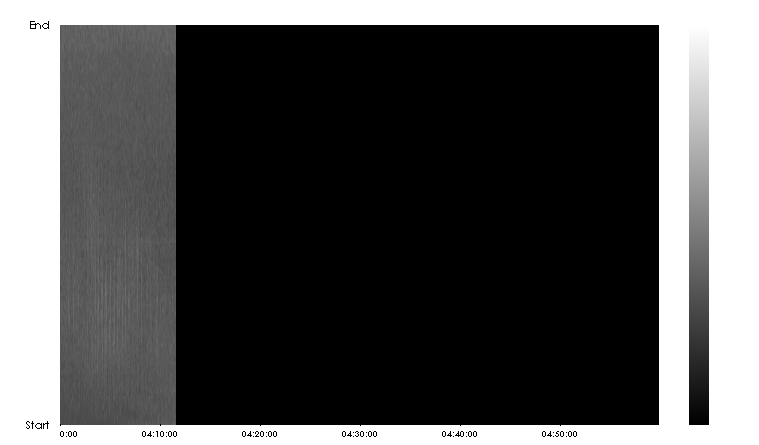
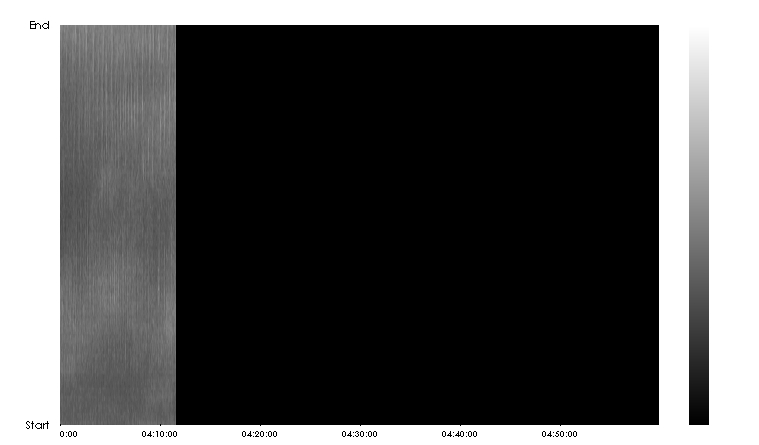
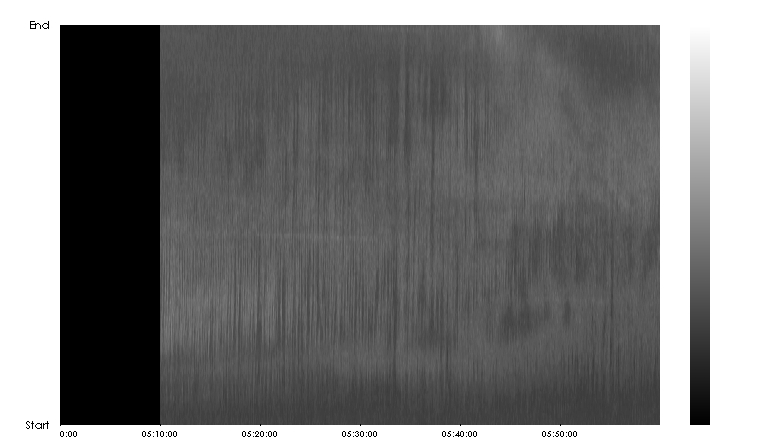
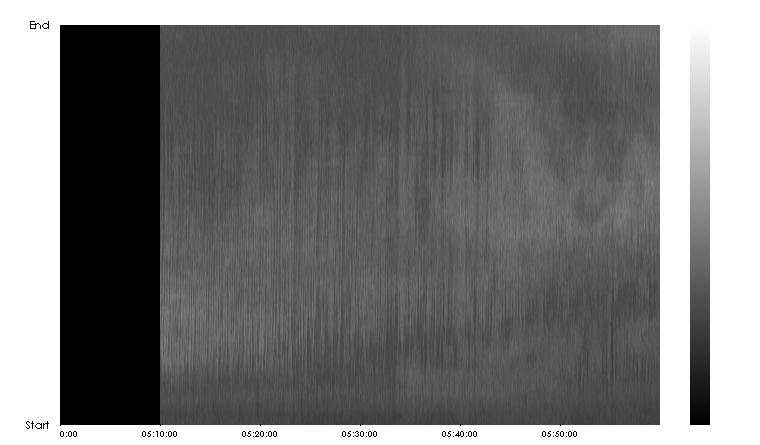
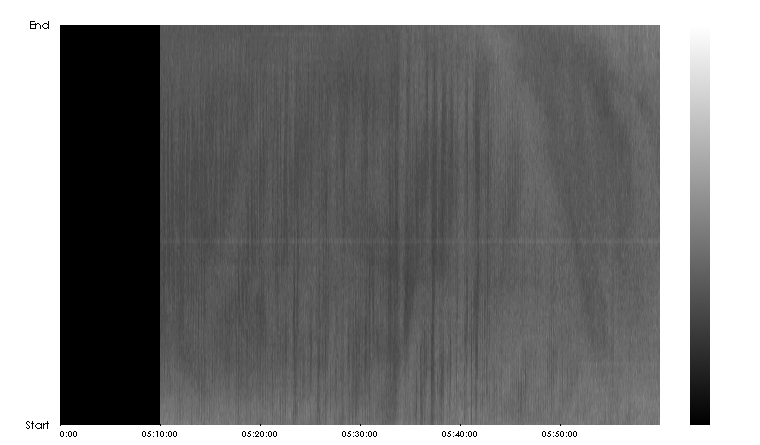
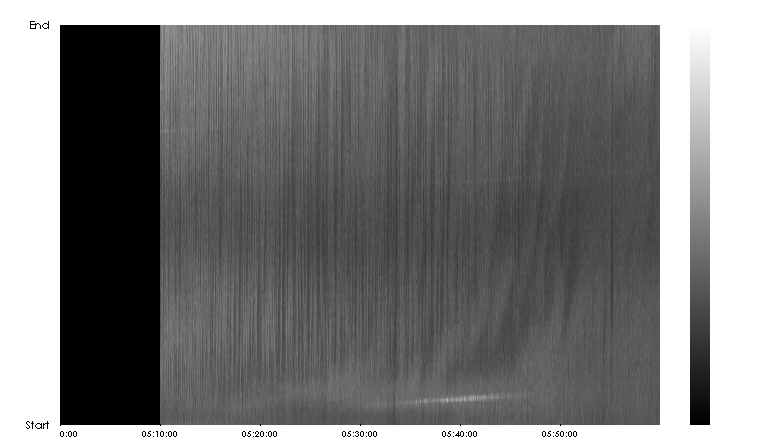
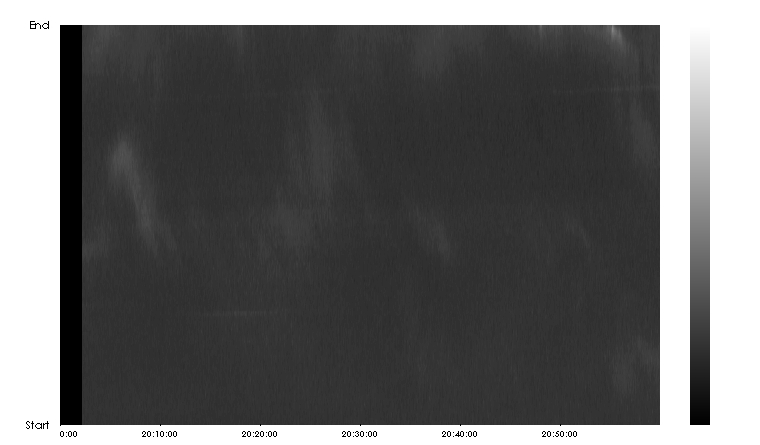
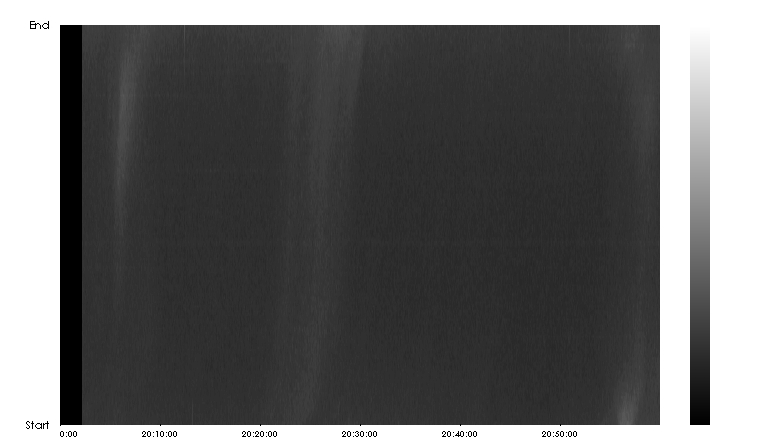
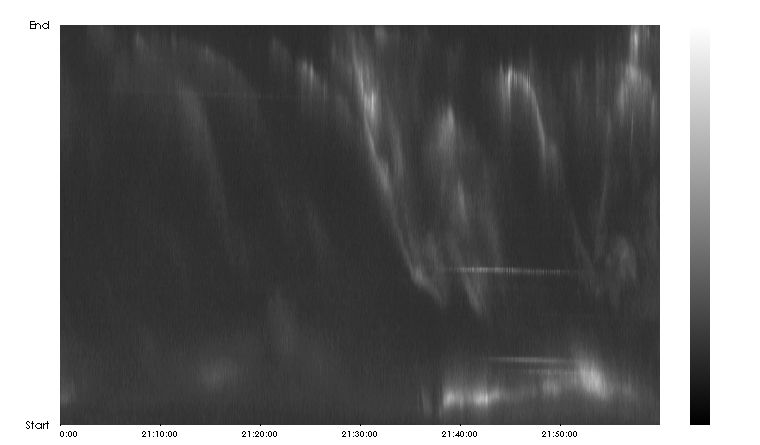
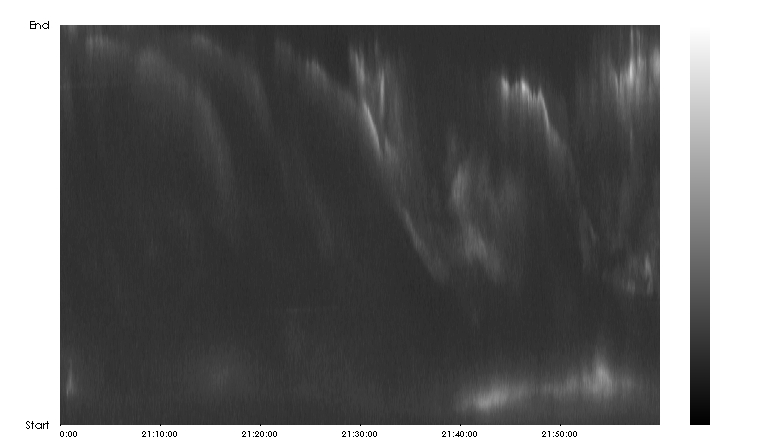
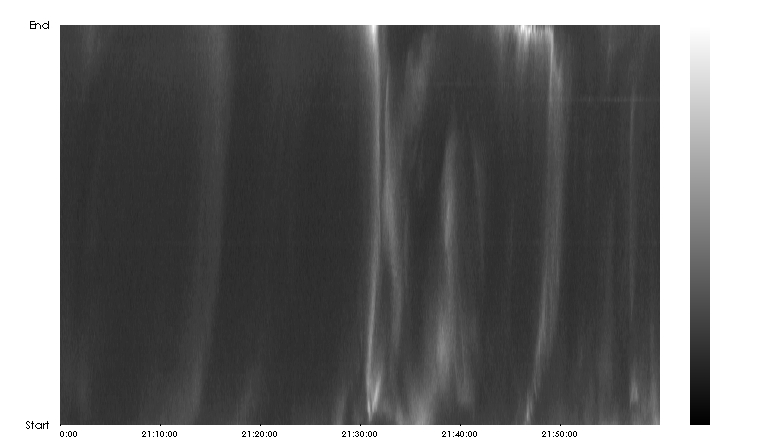
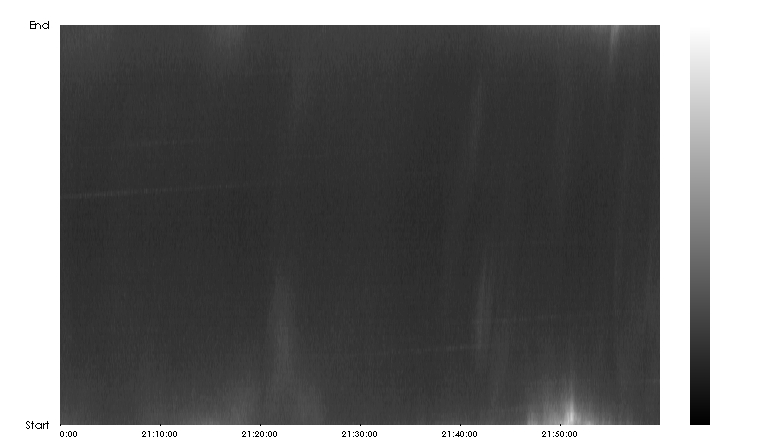
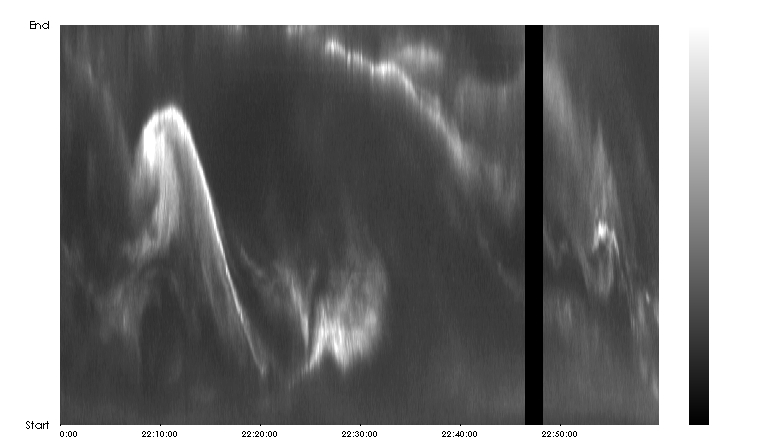
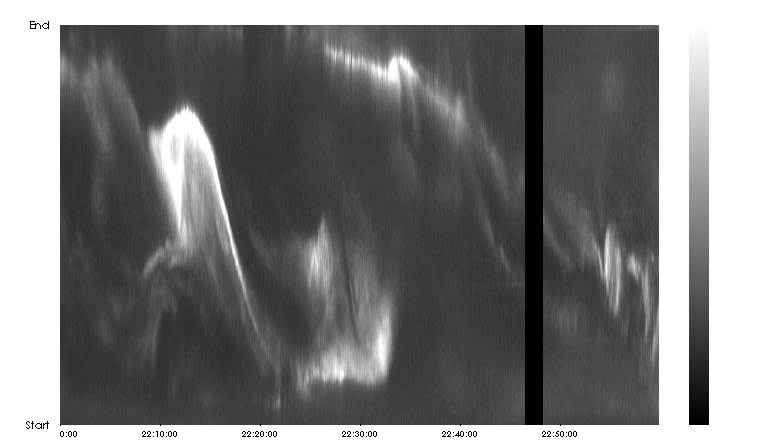
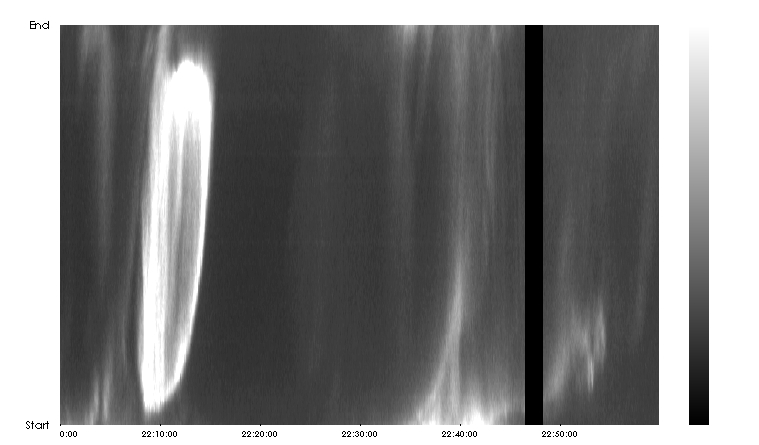
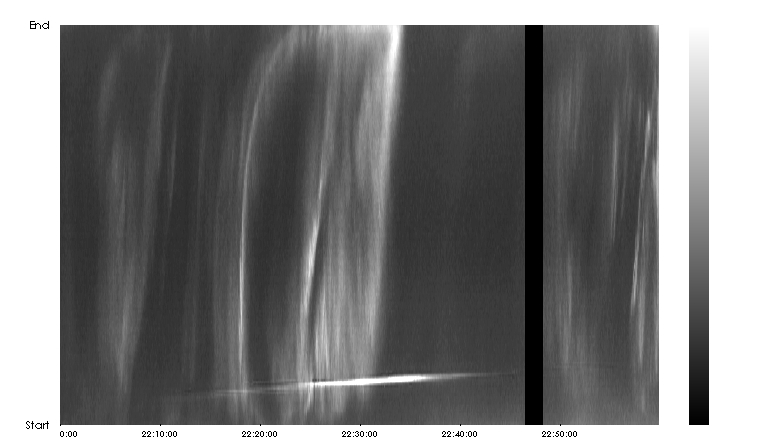
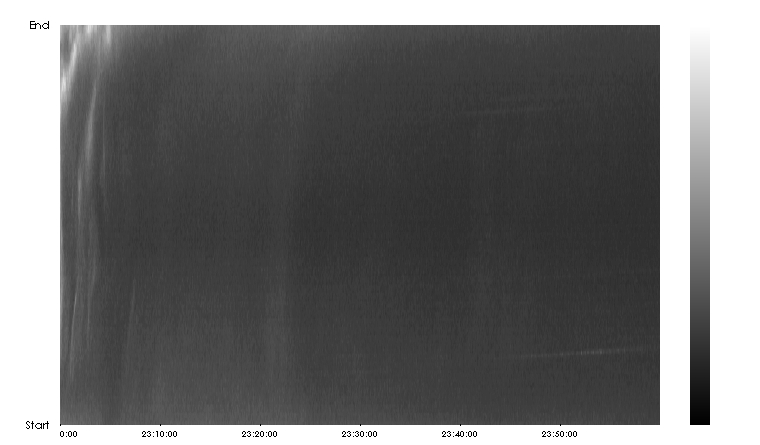
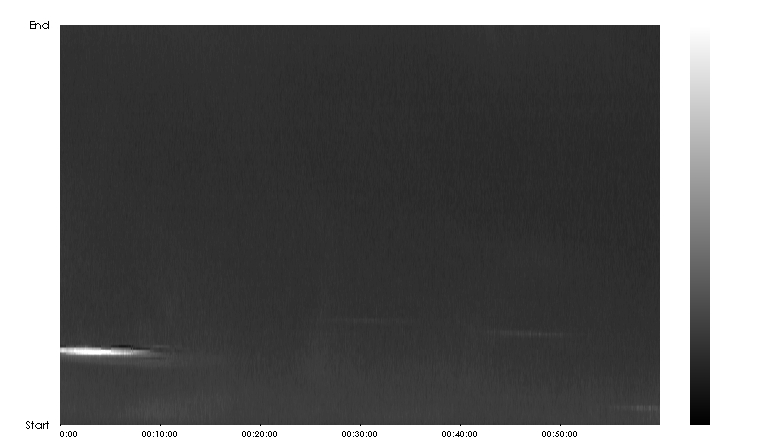
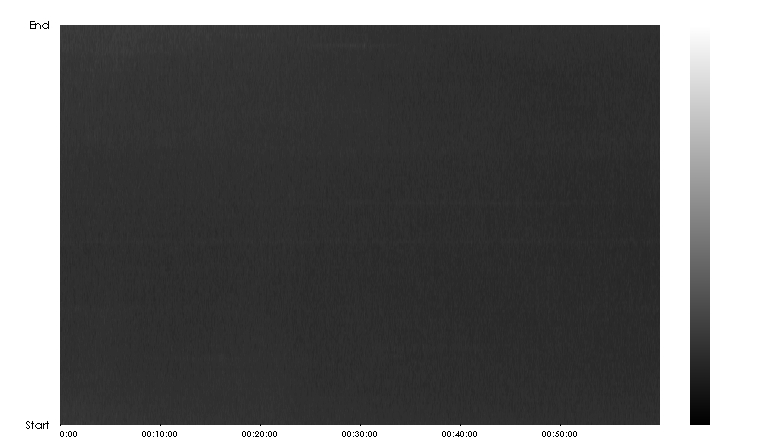
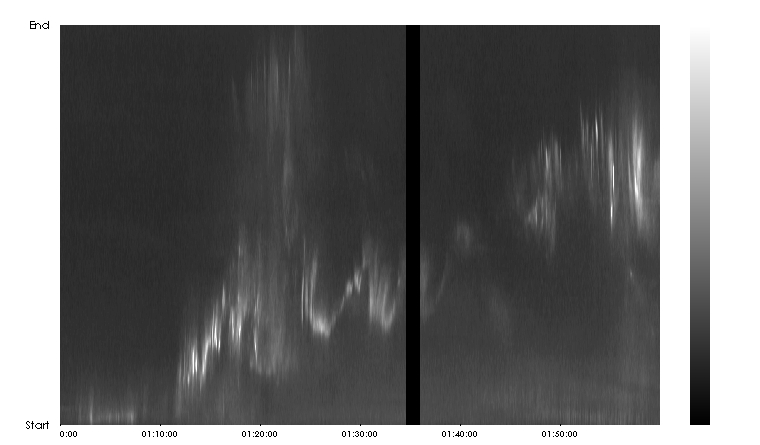
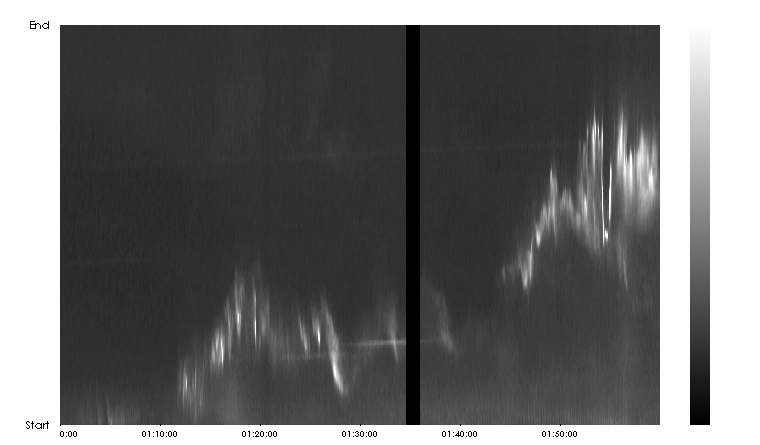
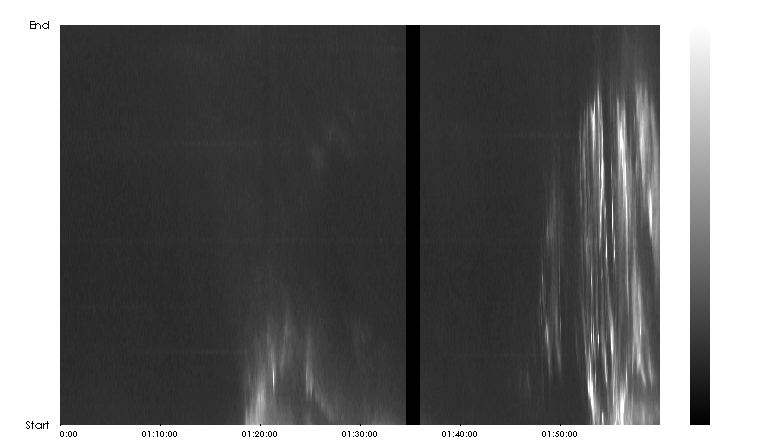
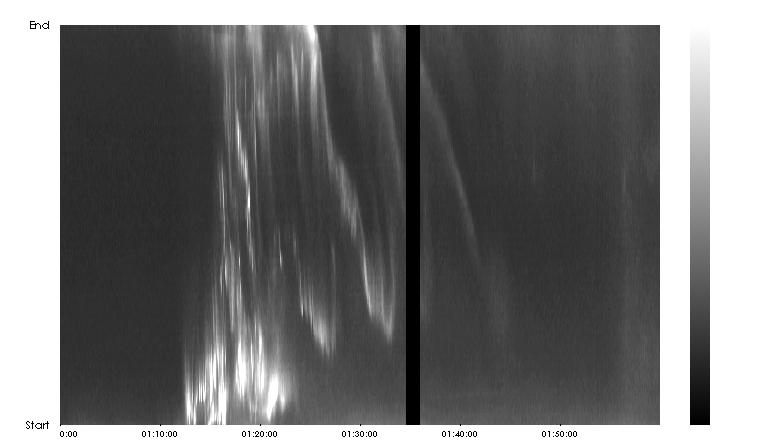
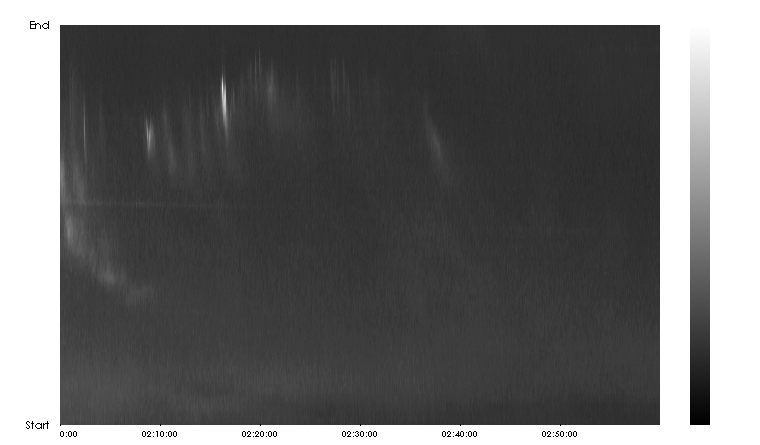
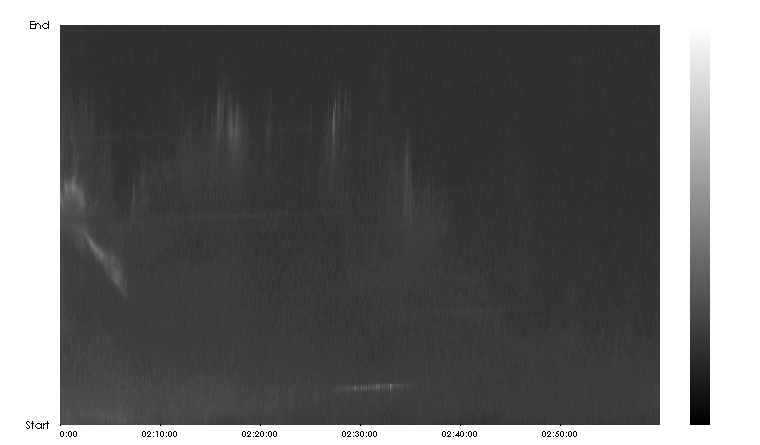
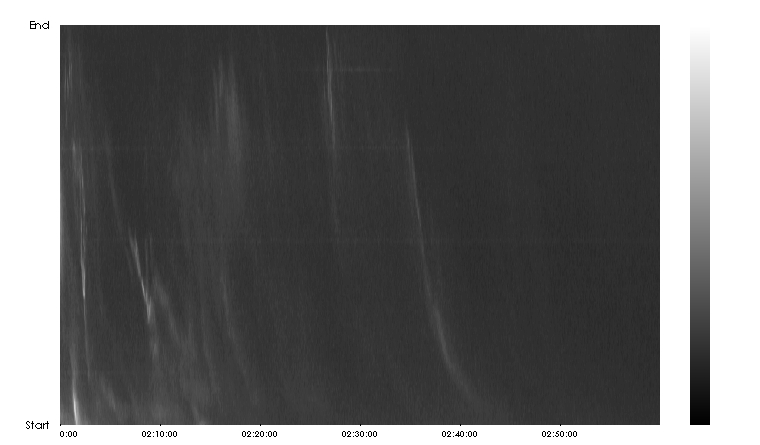
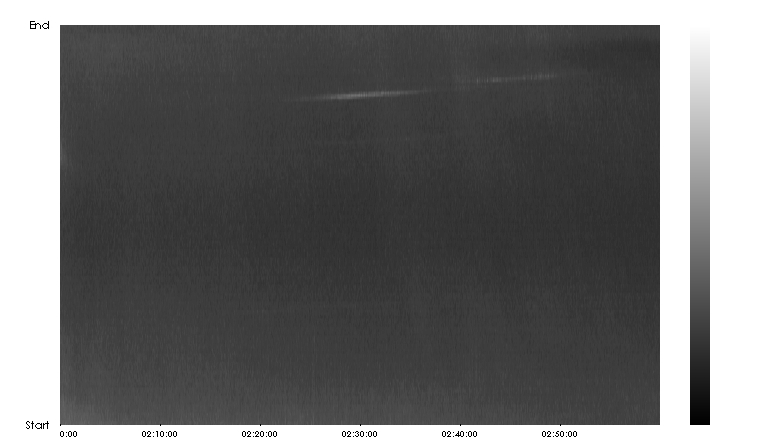
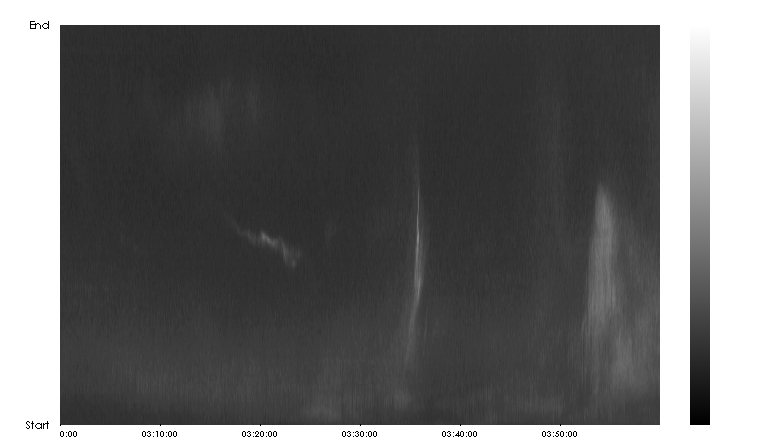
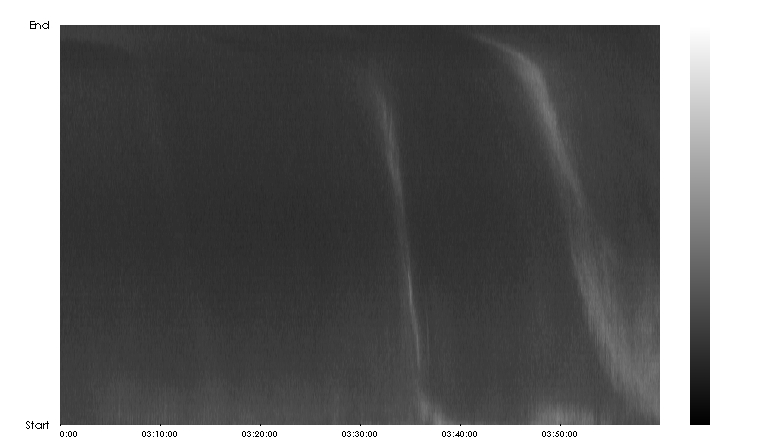
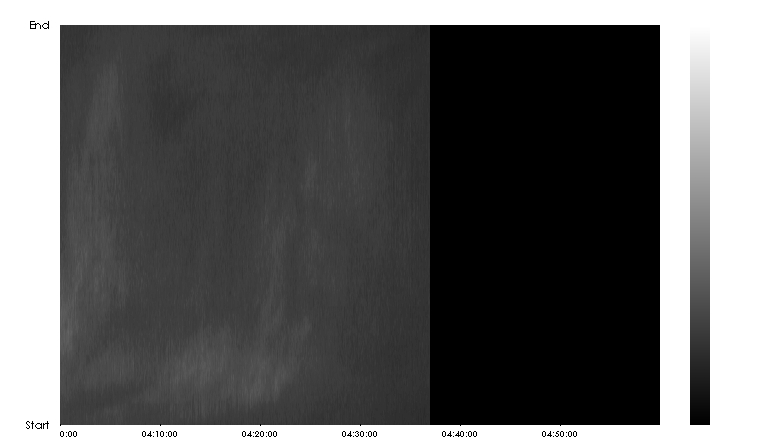
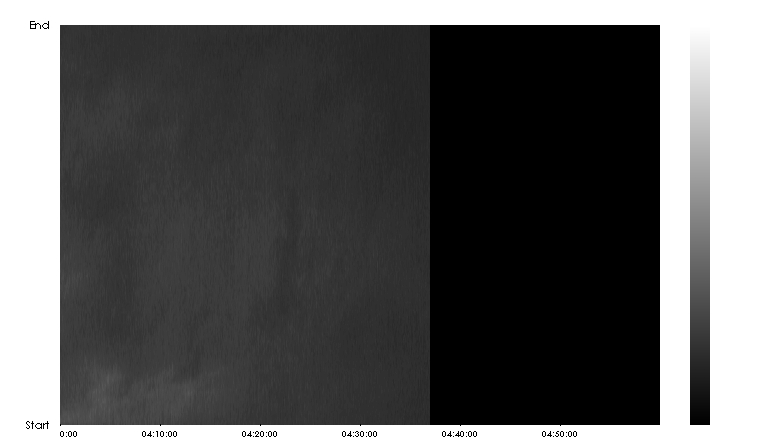
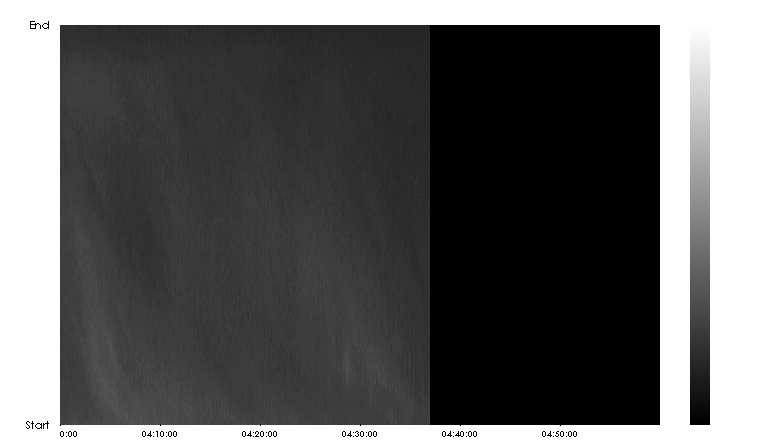
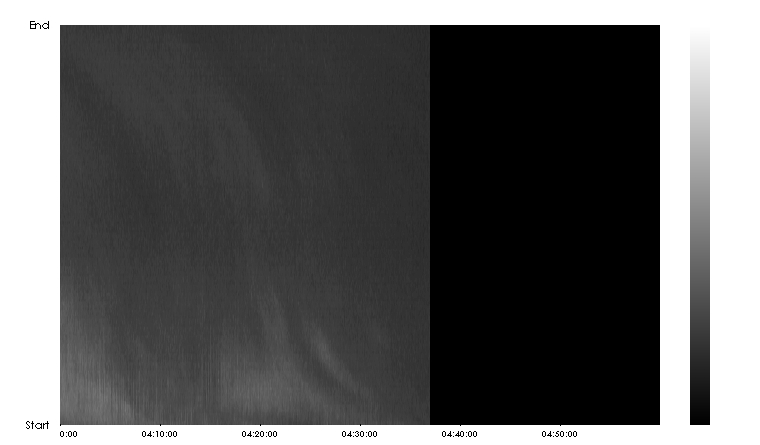
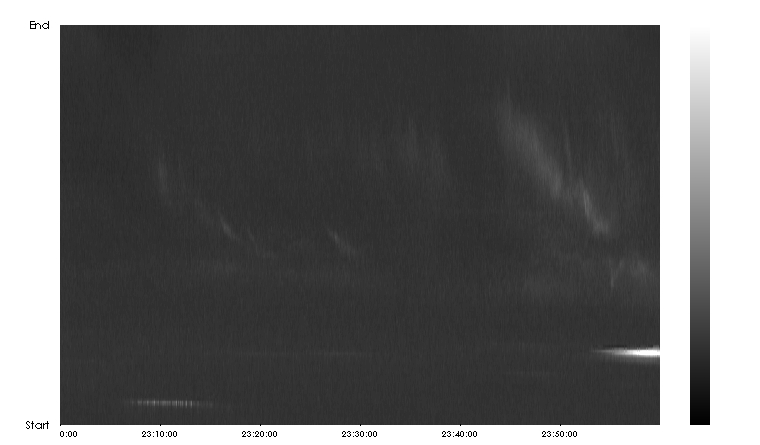
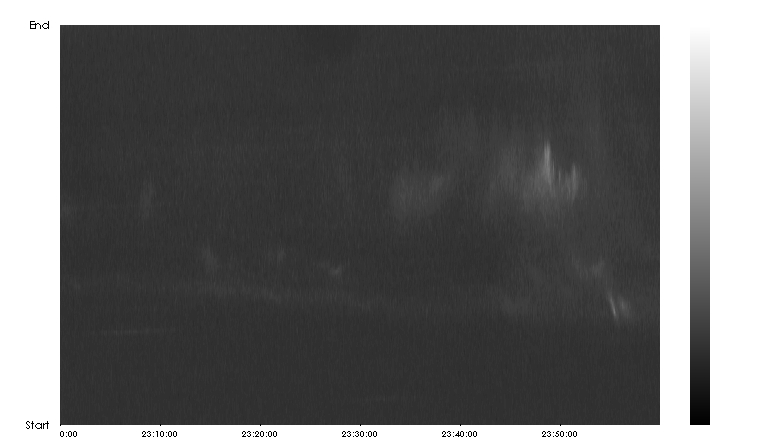
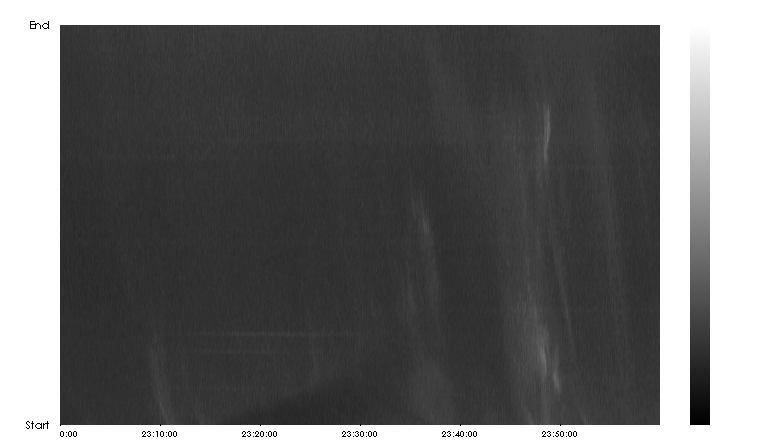
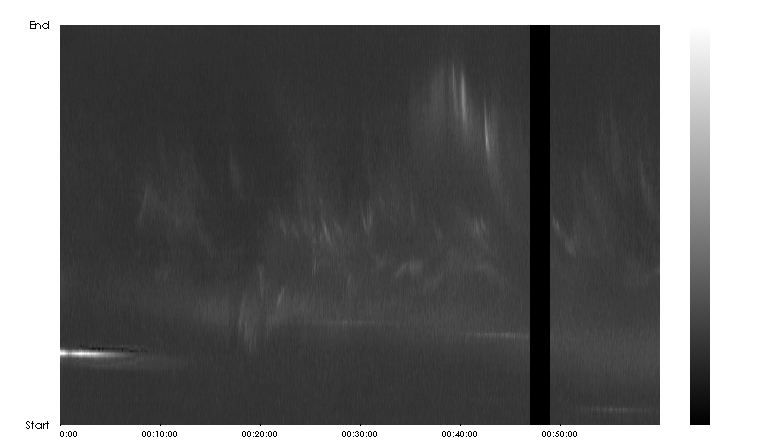
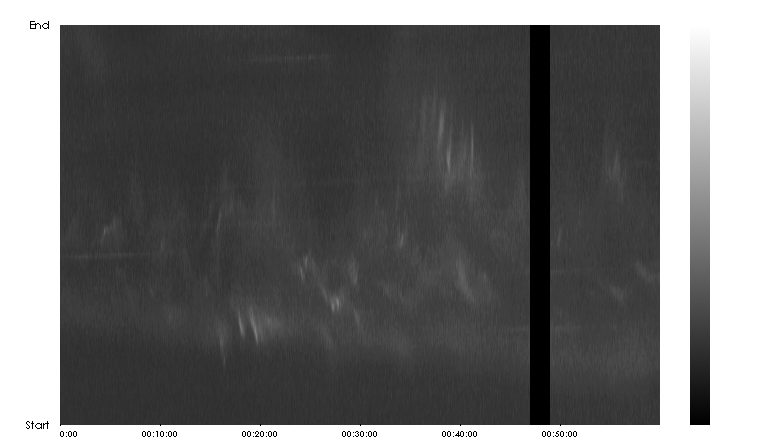
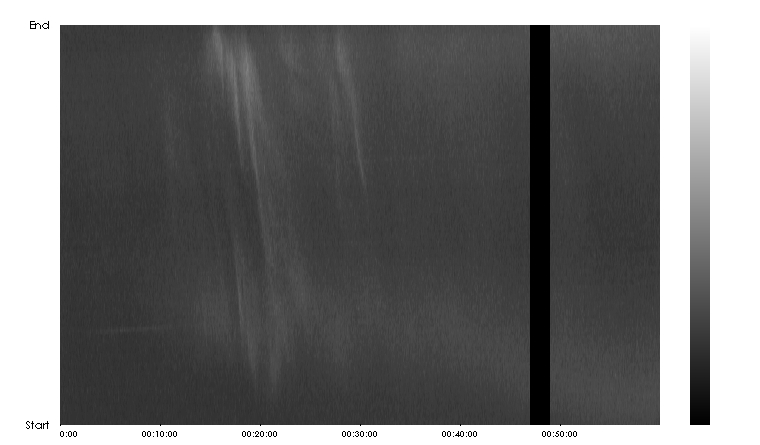
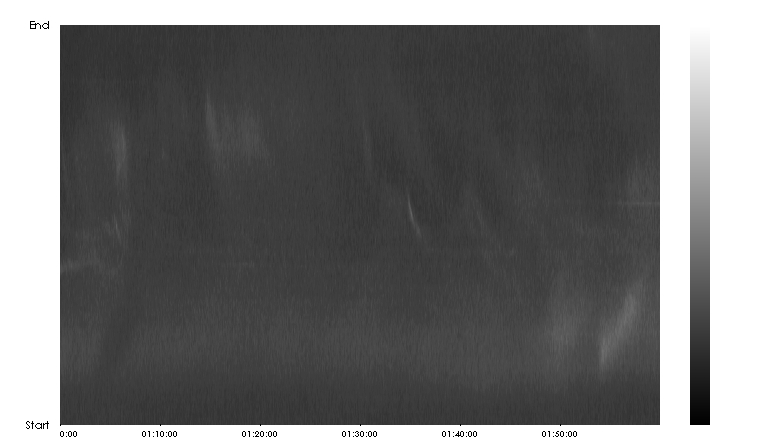
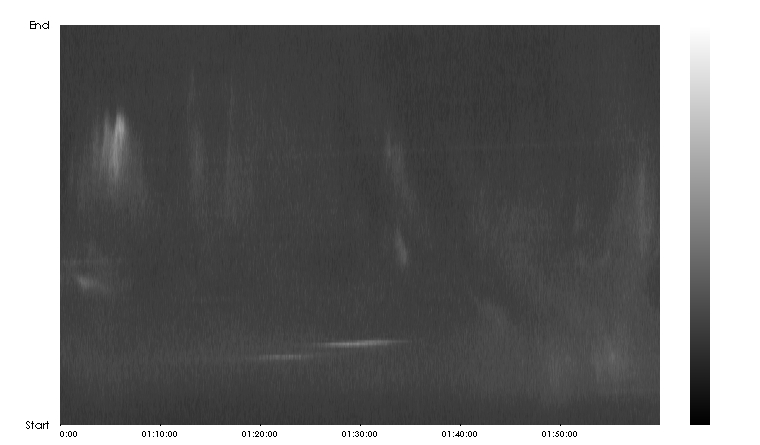
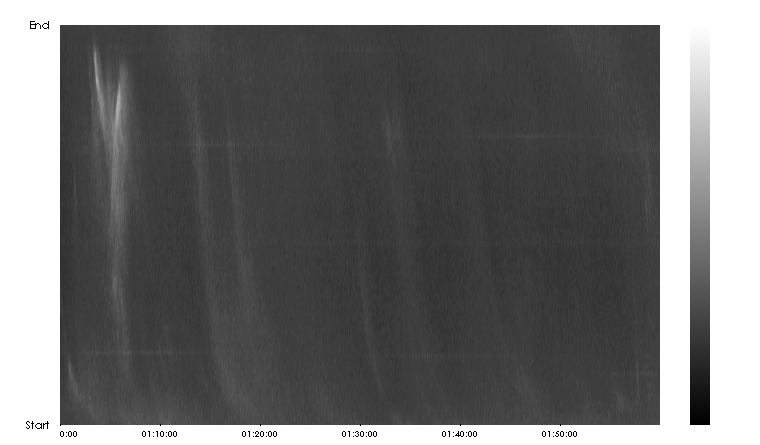
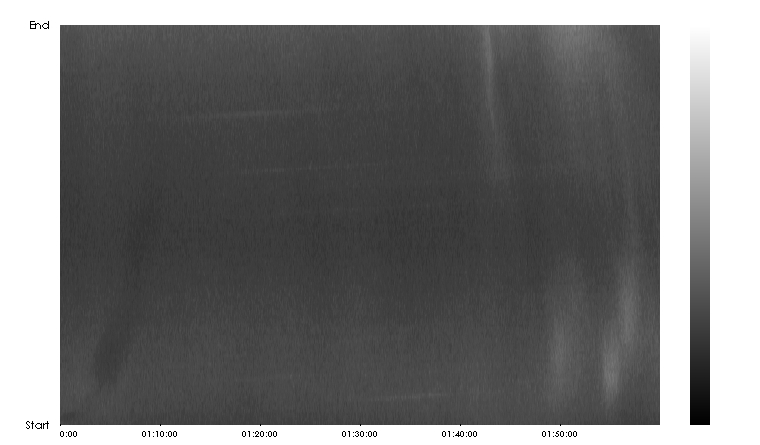
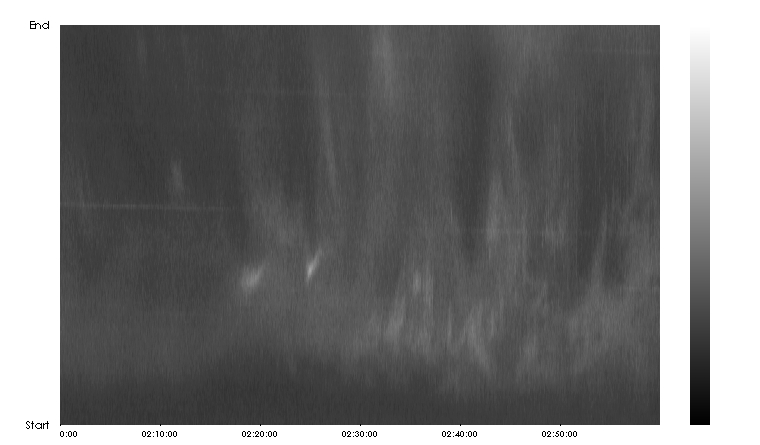
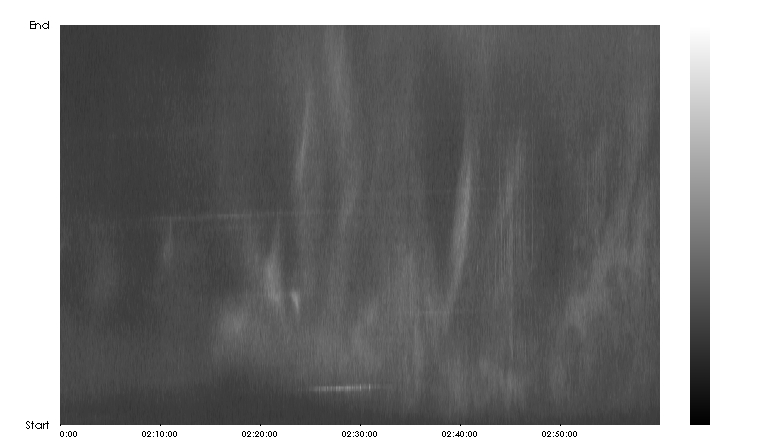
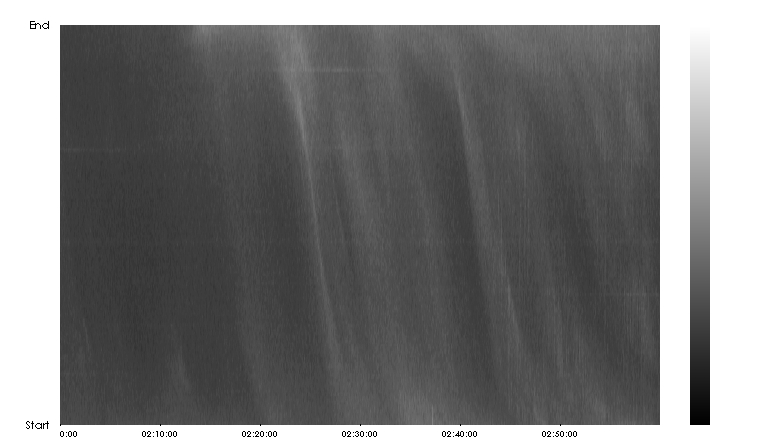
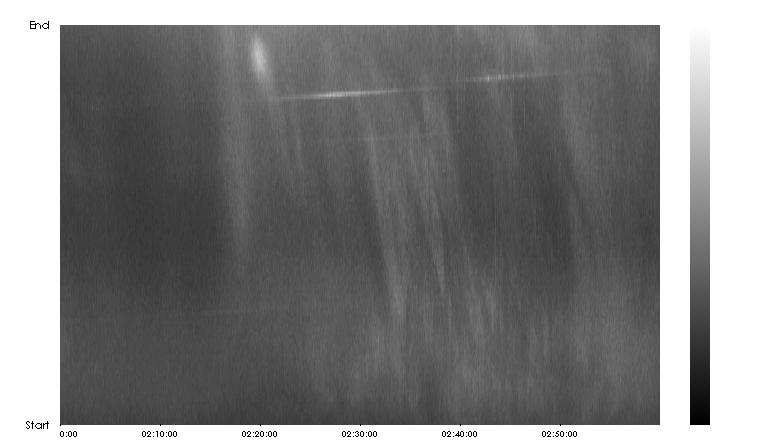
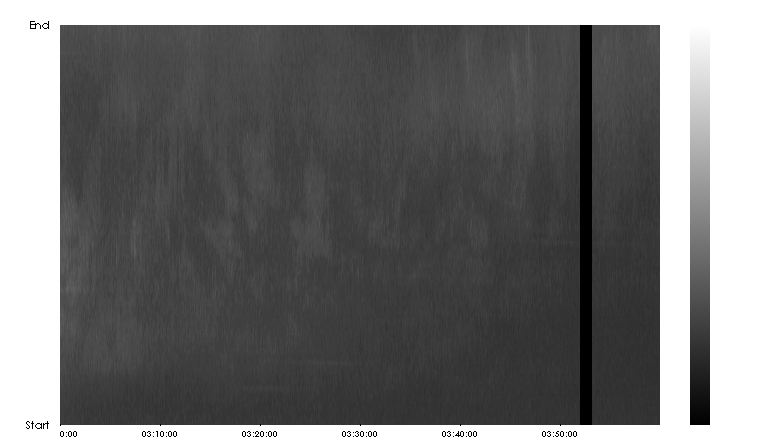
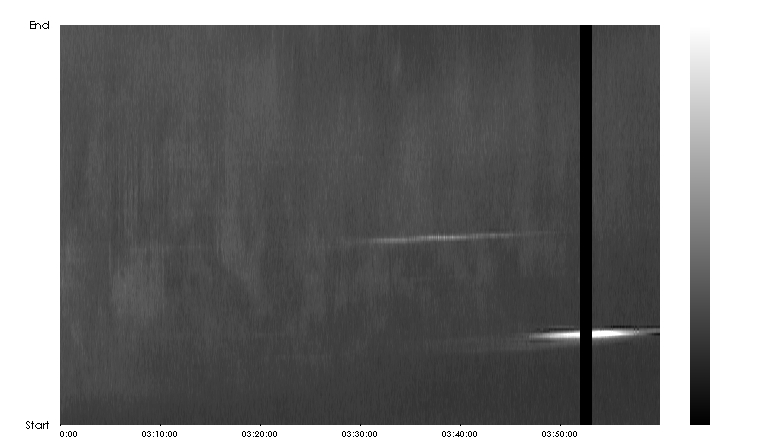
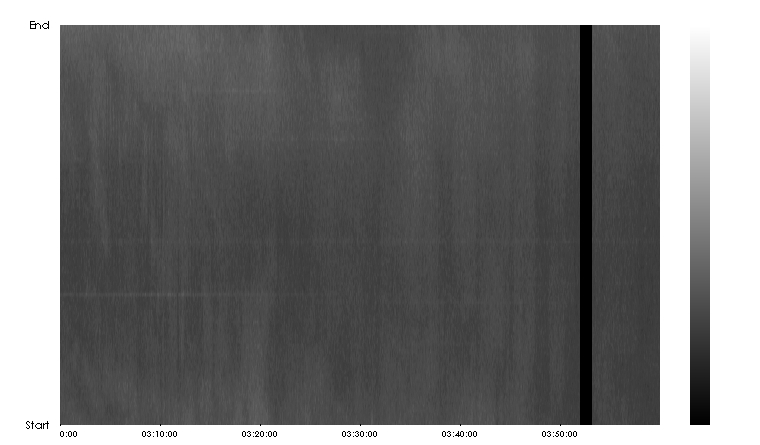
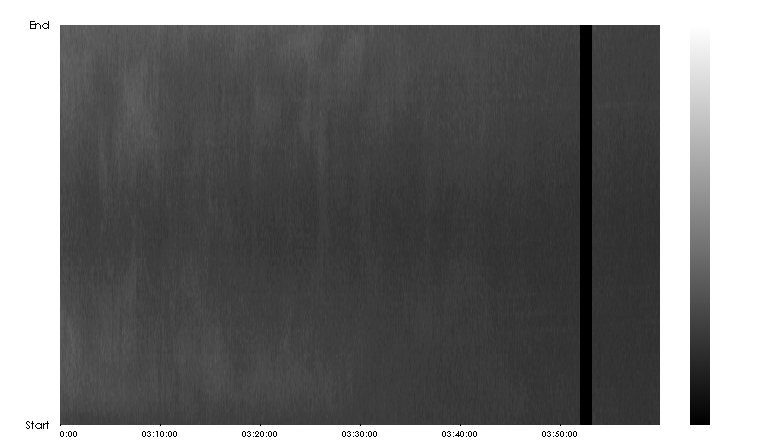
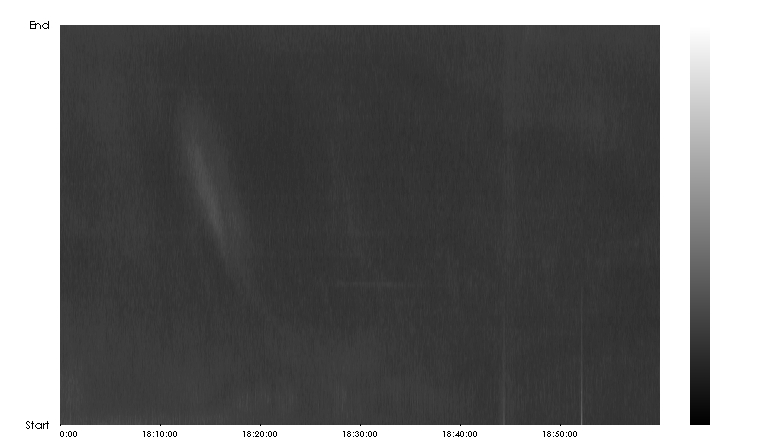
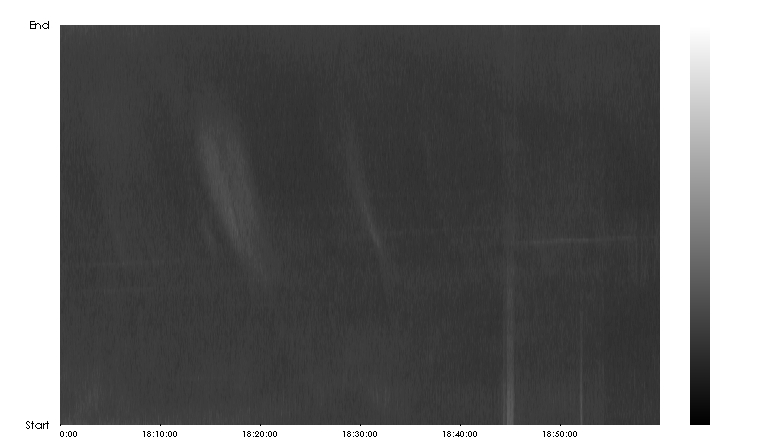
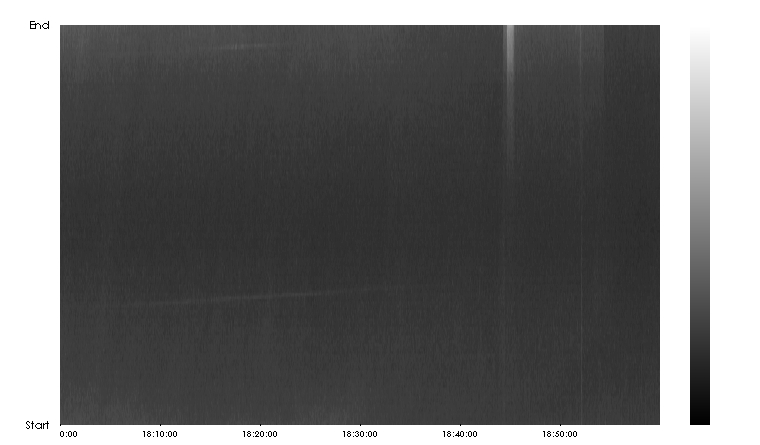
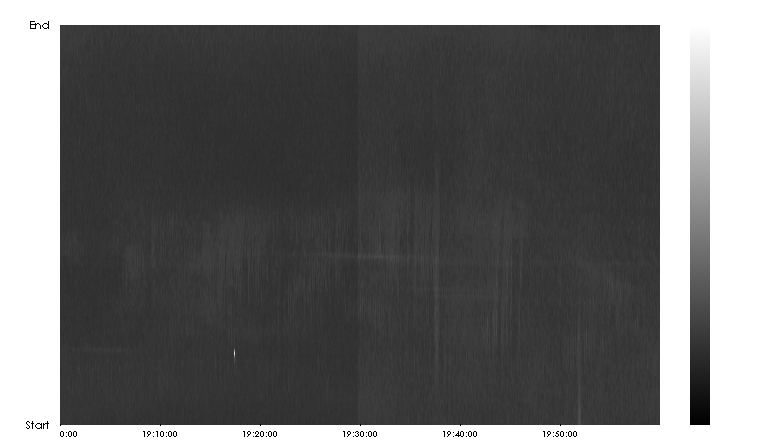
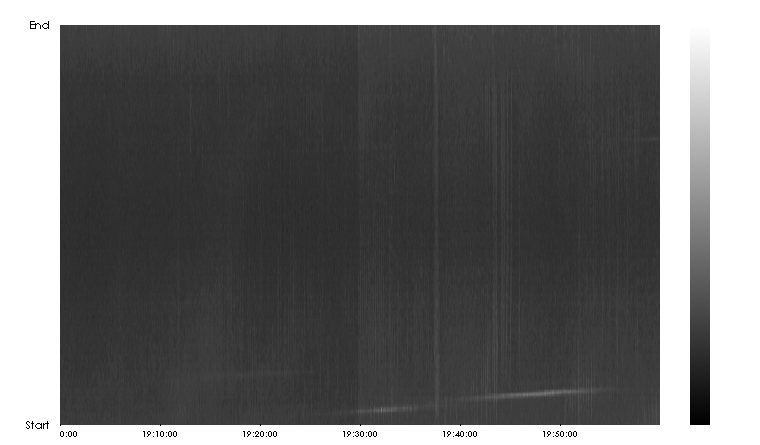
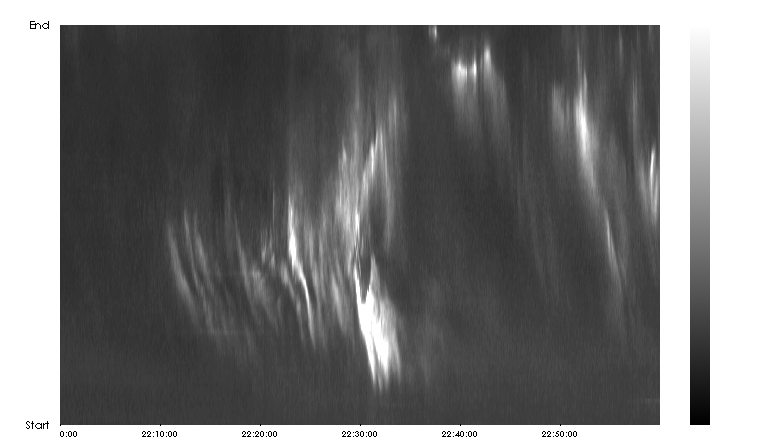
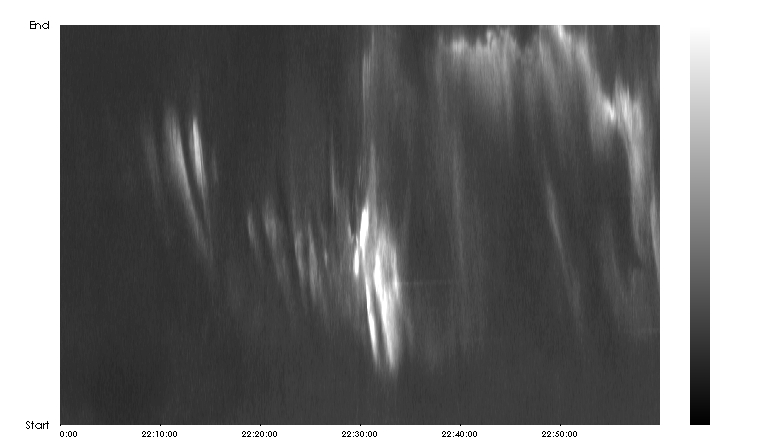
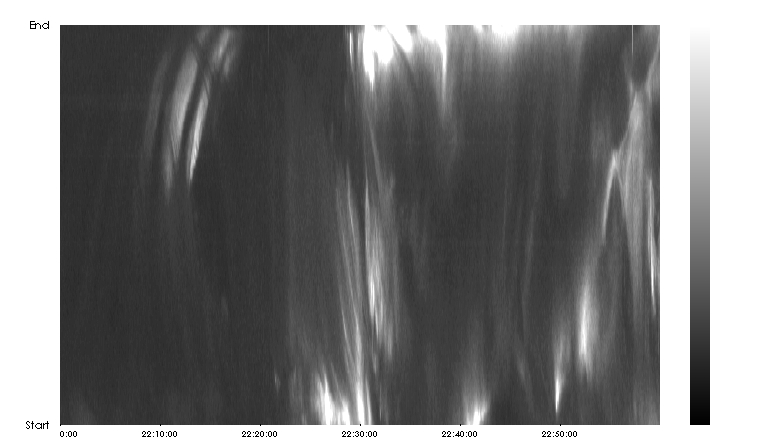
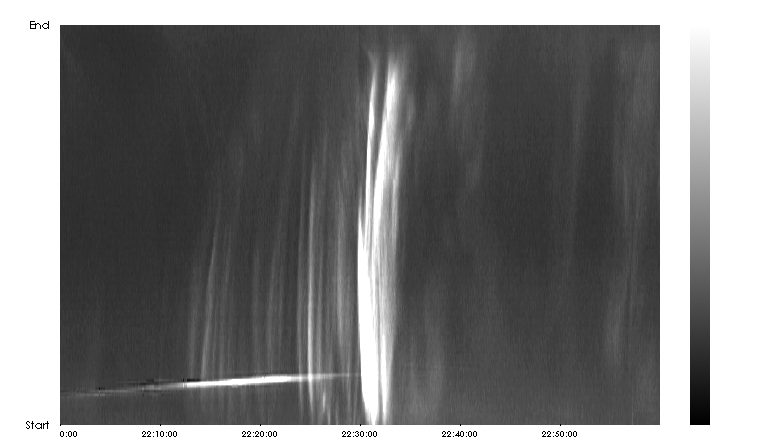
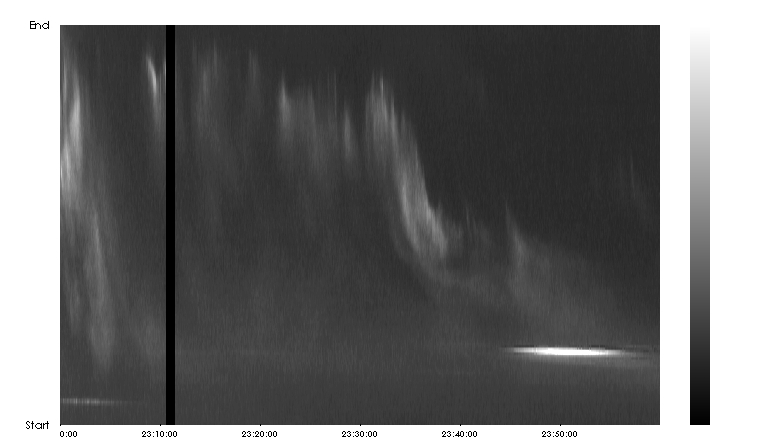
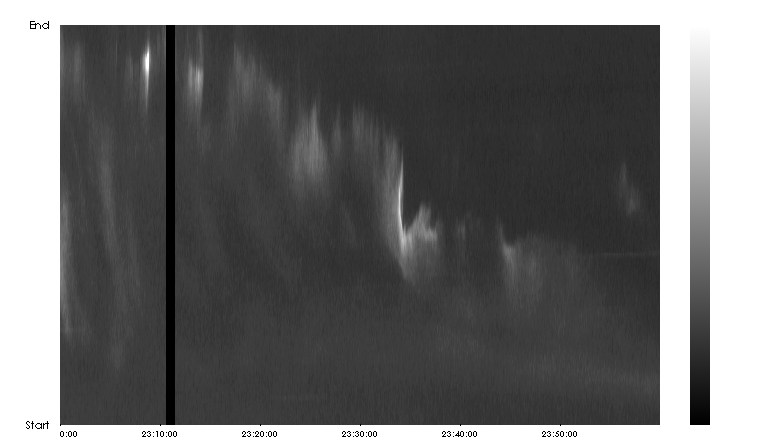
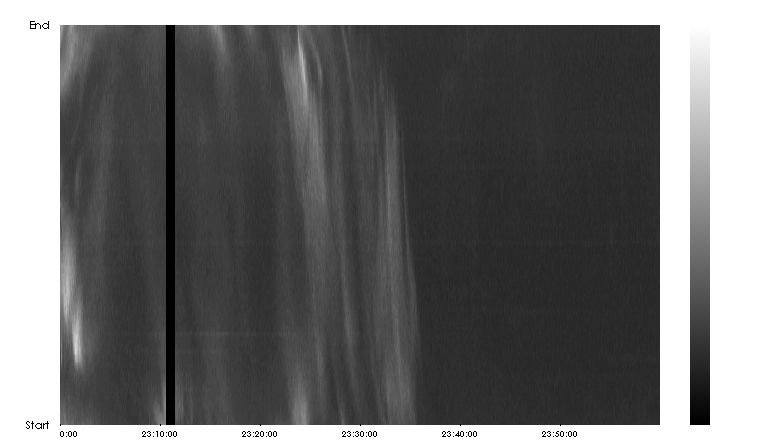
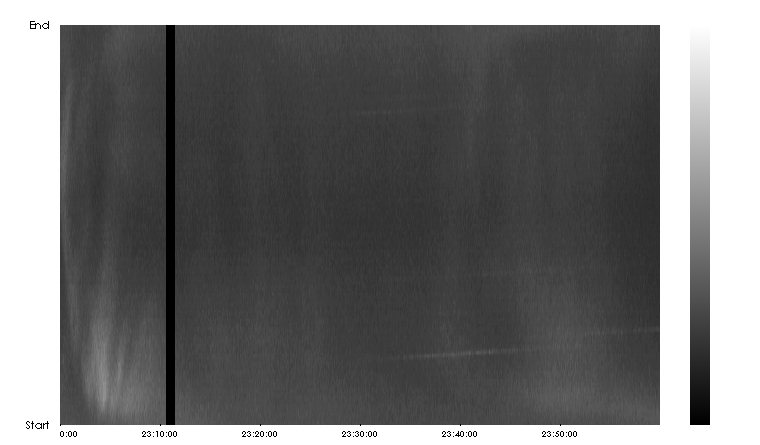
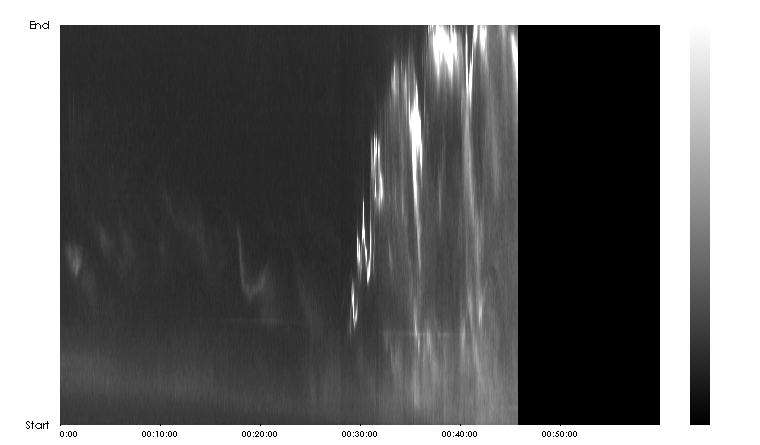
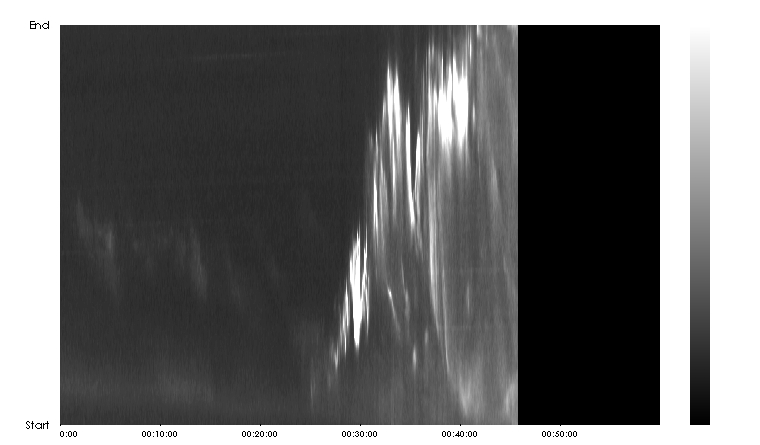
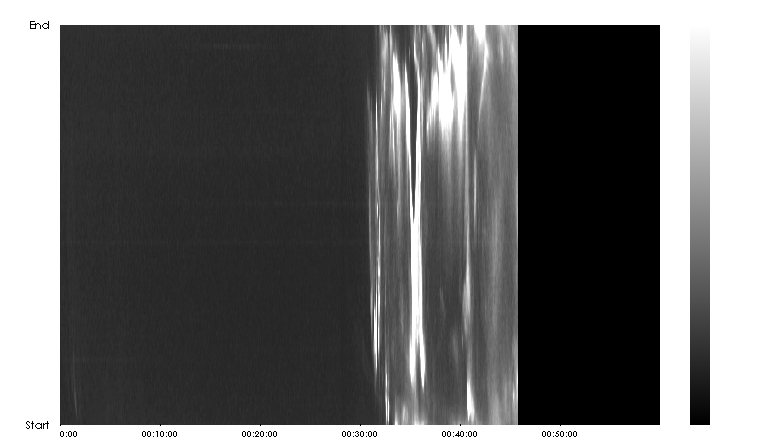
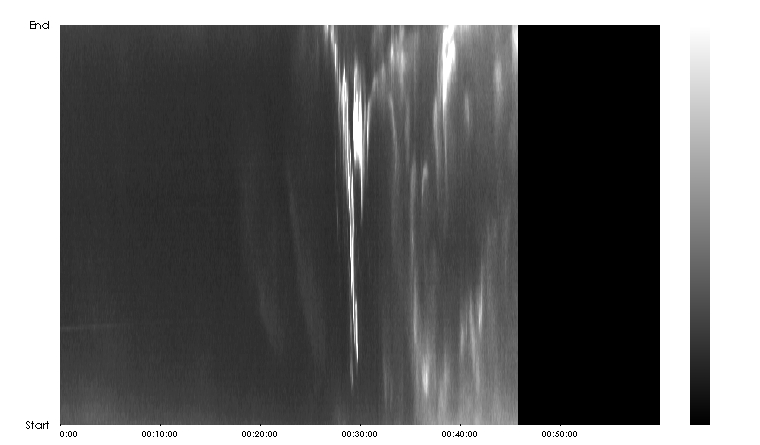
Introduction to Keogram:
Keogram shows auroral intensity along the selected line, which is produced from original TV data. The Keograms for Line 1 and 2 represent the North-South directions as shown in Figure (Line 1-2.jpg), and the Keograms for Line 3 and 4 represent the East-West directions as shown in Figure (Line 3-4.jpg). Each Keogram shows one hour time interval at different direction (Line).
Contact person:
Dr. Natsuo Sato
Professor
National Institute of Polar Research
1-9-10, Kaga, Itabashi-ku
Tokyo, 173-8515, Japan
Tel: +81-3-3962-5874
Fax: +81-3-3962-5704
E-mail: nsato@nipr.ac.jp
|
