Antarctic Geophysical Note No. 44
Vela Incident was proved to be marine nuclear explosions by the Syowa seismographic records
Kazuo Shibuya
Emeritus Professor of Geophysics
National Institute of Polar Research and SOKENDAI
e-mail: shibuya@nipr.ac.jp
30 March 2017
Abstract: Short-period Hagiwara's Electromagnetic Seismographs at Syowa Station, Antarctica, recorded onsets of marine nuclear explosions. These onsets have characteristic features which were very similar to those described in the Naval Research Laboratory report. However, the first incident time deduced from the Syowa records, ~14h59m UT of 22 September 1979, has time difference of about ~14 hours against the official? origin time of ~01h UT. The Vela Incident was also found to be a series of three or four marine nuclear explosions. I suspect this official origin time, and Mawson Station seismographic records will clarify this mystery.
1. Introduction
In the Antarctic Geophysical Note No. 24 (uploaded 15 November 2013, written in Japanese, http://polaris.nipr.ac.jp/~geophys-notes/Note/note24/index.html) of this series, I pointed out that Syowa seismographs recorded marine explosions, whose charge sizes (~ 3 kt) can only be explained by nuclear explosions. At that time there was no declassified information about hydro-acoustic data from the Naval Research Laboratory (e.g., Declassified Authority NNO 66817 in 39-Robert-A-Martin-INR-PMA-Political-Military.pdf) , and I did not know the existence of “Letter from US Naval Research Director Alan Berman on Hydro-acoustic Evidence on the Vela Incident,” December 11, 1980. I read History and Public Policy Program Digital Archive, National Security Archive. Contributed by Sasha Polakow-Suransky. In Wilson Center Digital Archive http://digitalarchive.wilsoncenter.org/document/116758). and also National Security Archive Electronic Briefing Book No. 570 “The Vela Incident: South Atlantic Mystery Flush in September 1979 Raised Questions about Nuclear Test” Edited by William Burr and Avner Cohen, Posted – December 8, 2016, and several other interpretative reports.
Now, I can compare Syowa seismographic results with Ascencion hydro-acoustic results; these results are shown to be mostly consistent each other, except very basic information on the origin time of the event.
2. Syowa seismographic records
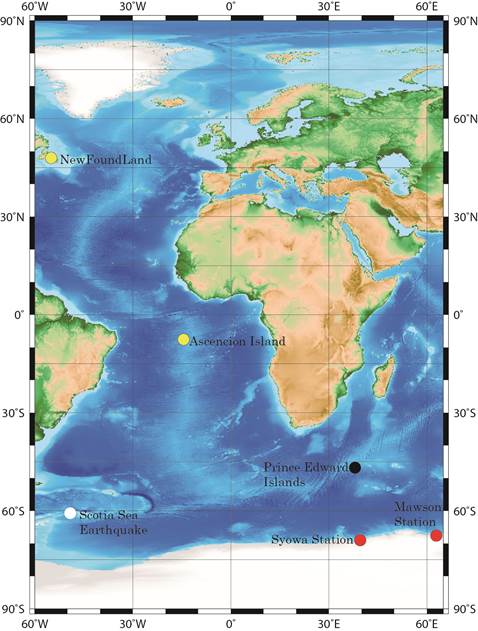
Japanese Antarctic Station “Syowa” is located at 69.0˚S, 39.6˚E on East Ongul Island, about 15 km distant from the main continent (Fig. 1).
 |
|---|
| Fig. 1. Syowa Station (red circle) is located on East Ongul Island, Antarctica. The station had two types of seismographs in 1979. One is called HES (natural frequency ~ 1 s, damping factor h = 0.7) of three components, which recorded Vela incident related signals generated at the Prince Edward Islands region (black circle). Declassified information from the Naval Research Laboratory indicates recording of hydro-acoustic signals at Ascencion Island in the Atlantic Ocean and at New Foundland, Canada (two yellow circles). Scotia Sea earthquake (white circle) occurred in the next-day of the VELA incident, and the seismic waves were recorded at both Syowa and Mawson Stations. Therefore Mawson seismographic data on September 22 may also have recorded VELA incident. |
Two types of seismographs are installed; one named HES (Hagiwara’s Electromagnetic Seismograph; Hagiwara, 1958) with a flat frequency response centered at around 0.6 s and covers 10‒0.5 Hz. The damping factor was set at h = 0.7 to suppress the coda waves. The other is called Press-Ewing long period seismograph with an adjusted frequency response centered at 12 s and covers 1‒20 s. Here “Press” is Frank Press, the president Carter’s science adviser and director of the Office of Science and Technology Policy, to convene a panel of scientific experts (the Ruina Panel) to review the available data and determine whether the “double flash” detected by the Vela 6911 bhangmeters was the result of a nuclear test.
The appendix shows the one-day-long seismic records from 1108UT 22 September to 1030 UT 23 September of the three component HES seismographs (top E‒W, middle N‒S, bottom Z = up‒down). Ground vibrations were recorded on optical microfilms with a speed of 2 cm/min, and the minute mark appears as a level shift of 00 second. Thirty level shifts appear as white gaps in one line, and 48 lines with each spacing of 0.5 mm constitute one-day record on a 24‒mm wide and 62 cm‒long microfilm.
Optical microfilms were changed every day. Recording day and the component were hand-noted on each microfilm by the wintering-over expedition member (for this figure JARE‒20 geophysicist Takeshi Morikawa from the Earthquake Research Institute, the University of Tokyo) at the time of film replacement. Therefore, it is assured that time base of the detected events is 100% correct. Although I displayed copies of the original microfilms in Fig. 2 of Note No.24, fine features may not be read, and in this Note No.44, about five-to-six times enlarged copies are displayed in the appendix. Arrangement of pages (1/6) to (6/6) from left to right will make the enlarged continuous traces of the original microfilms in Fig. 2 of Note No.24.
Three‒component Press‒Ewing seismographs could not clearly detect the event because the generated seismic waves were not within the period range of 1‒20 s.
3. Detected features of the event from Syowa seismographic records
For seismologists, characteristic features of the events are self-explanatory from the records in the Appendix. I described the explanation in Note No.24 in Japanese, and think it unnecessary to revise the interpretation. As details are of secondary importance, I describe in this English Note No.44 just the summary of the features:
- This was not the underground explosion because underground explosion is usually associated with a rapidly-decaying impulsive waveform of less than 1 minute duration in the HES records.
- This was not the atmospheric explosion because atmospheric explosion transfers small amount of energy into sea water, and duration of more than 1 minute duration at Syowa Station means Mt-order charge size in the case of atmospheric explosions. This must leave much easily detectable radioactive fallouts. If this was a kt-order atmospheric explosion, the event could not be detected at all at Syowa Station. The records in the Appendix are inconsistent with this explanation.
- The observed seismic waveforms looked to those of underwater explosions of 1~10 kt order chemical charge which had been made in long range shots to reveal crustal structure of the oceanic lithosphere. However, this means deployment/recovery of ocean bottom seismographs using several medium-scale research ships (~ 1000 t each) and operation time of ~ 1 month. Today it is known such geophysical experiments were not made in the area concerned. Only underwater small-scale nuclear explosion can explain the characteristic features of the seismic records in the Appendix.
There are interesting features in the observed seismic records in the Appendix.
- The event was not a single shot but was a series of three (or four?) shots. The first was detected at 15h03m46s with a duration time of ~2 minutes + 50 seconds. The second seemed to start at 15h10m42s, but was followed by another one at 15h14m30s without clear separation and continued to 15h18m30s of a 4 minutes’ duration. The third (last) was detected from 15h19m50s with the longest duration time of 5 minutes plus 10 seconds.
- From the magnification of the seismograph (~5 x 10⁴) and the trace amplitude of 1.2 mm on the film, synthetic magnitude of the first event can be calculated as M = 3.7, e.g. by using a formula by Vanӗk et al. (1962). As for the second and third shots, the magnitude could be estimated as 3.1 and 3.5 respectively. Application of another empirical formula using duration seconds of the oscillation supports these charge sizes.
- From the simulation study, e.g. by Wielandt (1975), oscillating frequency of the generated bubble (TB) is known to be a function of W (charge in TNT kg) and explosion depth h (m) in water (see Note No.24). Although bubble frequency is not clear in the seismographs of the Appendix, it will be around 0.5 – 1.0 s. Charge size W of 3 kt (3 x 10⁶ kg) and depth h of 200 – 1000 m generates predominant frequency of about 1 s; this frequency is suitable to be detected by the HES seismographs at Syowa Station.
4. Comparison with the hydro-acoustic data analyzed by the Naval Research Laboratory.
Although hydro-acoustic information by the Naval Research Laboratory was not declassified when I wrote the Note No.24 in November 2013, we can now refer to the information, especially the Fax by Alan Berman (Director of Research) to John M. Marcum, Senior Adviser for Technology and Arms Control, Executive Office of the President Office of Science and Technology Policy (Letter from US Naval Research Lab Director, Digital Archive in the Wilson Center, as cited in the introduction). There are eight items and I will discuss them in view of consistency/inconsistency of the Syowa seismographic records.
Item 1 describes that the energy release was detected by three wide band hydrophones near Ascension Island around 0243 UT on 22 September 1979. The signal-to-noise ratio of the event was about 25 db. I marked location of Ascension Island in the Atlantic by a yellow circle in Fig. 1. The signal-to-noise ratio of 25 db (about 317 to 1) is one order of magnitude better than that of Syowa seismographic records, but both must have detected onsets of the event clearly.
Item 2 describes the travel time of the hydro-acoustic wave from the assumed incident location (Prince Edward Island; black circle in Fig. 1) to Ascension. Sound speed of 1500 m/s and distance of 10,000 km results in travel time of 1 hour and 51 minutes. From Item 1, Vela event must have occurred at around 0051 UT; the fax concluded. This origin time is not consistent with that from the Syowa seismographic records, and this is the main mystery about the Vela incident. I will discuss this later in section 5.
Item 3 describes that the VELA alert footprint was confined to the southern hemisphere. The time sequence of arrivals at the Ascension hydrophones indicate that the 0243 UT signal arrived at Ascension Island from a bearing of 198˚±10˚, suggesting probable location of the event. As for Syowa seismographic records, it is not possible to infer location of the event only by one station. Ground particle motion is difficult to be calculated because of thin record lines, and a bearing of the event location could not be determined, only from the Syowa records. I will also discuss this in section 5.
Items 4, 5 and 6 describe line frequency structure, quite high level of a signal 25 db above the ambient back-ground noise at distance of about 10,000 km, and absence of Rayleigh wave coupling mechanism in the observed Ascension hydro-acoustic signal. Comparison with the previous French nuclear test in the Pacific, which was detonated 500 meters above the water surface, suggests that the observed signals at Ascension were consistent with theoretical predictions for an explosion of ~2 kT above a thin sedimentary layer below sea surface; the Fax concluded. Estimation method of charge size using seismic waves is different from that of hydro-acoustic signal. But the conclusion of 2~3 kT is very consistent each other. Though I do not go into details of variety of three shots, apparent variation of bubble frequencies (inferred from later phases) may indicate that efficiency of detonation may have been tested by changing explosion depths from the sea surface.
Item 7 gives an additional note on the energy release. Because of the strength of the observed signal, the explosion must have taken place in air over shallow water underlain by hard rock basement, or underwater; the Fax concluded. If energy release took place underwater, then no signal would have been detected by the VELA satellite. I agree with this underwater assumption, however the third one may be failed and the bubble may have been opened into air. Then, VELA satellite may have detected this failed underwater detonation. Detonation in air, even if it took place above shallow waters, means operation by an airplane. Dark night and probable bad weather on 01UT of September 22 must have been too risky to accomplish this test. Detonation underwater must have been much easier.
Item 8 strengthens Item 3, and concludes that the VELA incident took place in the area of the Prince Edward and Marion Islands. Seismographic data may independently reach to this conclusion if we have another station data, and I will discuss this point in section 5.
5. On the mystery of the VELA incident time
As shown in the Syowa seismographic records in the Appendix, the first onset of the event was around 15h03m46s UT of 22 September 1979. This leads to the detonation time at ~14h59m under the assumption of the event location at Prince Edward Island, and seismic velocity of ~5 km/s toward the distance of 1400 km south to Syowa Station (see Fig. 1). It is noted that this onset was already reported in the JARE Data Reports Seismology 14 (Kaminuma, 1981) as re-tabulated in Table 1.
Table 1. Vela Incident (A) and Scotia Sea earthquake (B) detected at Syowa Station
| Evnet | Date | Phase | Arrival Time | Period | Amplitude | ||
|---|---|---|---|---|---|---|---|
| H | M | S | (s) | (mm) | |||
| A | SEP22 | +EPN | 15 | 03 | 13.8 | 1.1 | 1.0 |
| +EPZ | 15 | 03 | 13.6 | 1.2 | 1.2 | ||
| B | SEP23 | IPE | 22 | 50 | 41.2 | ||
| -IPN | 22 | 50 | 41.3 | 1.2 | 4.0 | ||
| IPZ | 22 | 50 | 41.2 | ||||
| LP EPE | 22 | 50 | 46.9 | ||||
| LP EPN | 22 | 50 | 46.9 | ||||
| LP+EPZ | 22 | 50 | 43.1 | 9.4 | 4.0 | ||
| LP+ISE | 22 | 56 | 18.8 | 16.9 | 13.0 | ||
| LP+ISN | 22 | 56 | 18.8 | 15.0 | 19.0 | ||
Because these data were used in the hypocenter determination, and because these were sent to the National Earthquake Information Center (NEIS) for Preliminary Determination of Epicenters (PDE report) via Mawson Australian Antarctic Station (red circle in Fig. 1), any seismic data from Syowa were (are) based on the UT. This is always consistent with the hand-written memo on the microfilms. On the other hand, there was no event recorded at around 00-02 UT, one-day before microfilm set of the Appendix. Therefore, I have doubt about the incident time described in the declassified/still-classified reports.
Moreover, JARE Data Reports Seismology 14 listed the arrival time data of the event B of Table 1. Although not shown here, the event B was recorded on the three microfilms of the next-day set (23 September1979 1031UT – 24 September 1979 1105UT), without losing any two-minute lines. From the International Seismological Centre Bulletin 1979 SEP, we know that this event B occurred at 23d22h43m39.0s, 60˚57S, 50˚36W, h = 3 km, Mb = 5.8 in the Scotia Sea region (white circle in Fig. 1). This Scotia Sea event B was recorded at Mawson Station, because ISC Bulletin listed the onset time as IP 23d22h51m43.5s at Mawson Station. Therefore, it is highly probable that Mawson Station also recorded the VELA incident one-day-before, if the station had operated HES-like short-period (predominant frequency of 1.0 s) seismographs at that time.
If I am right, the first declassified incident time information is “MORD DocID: 1108246, E83A Approval for release date: JUN 2004, about the JAN 25 1980 Report titled “The 22 September 1979 Event”. In Page 5 of Discussion there is a sentence “The event detected by optical sensors on a Vela satellite at about 0100 GMT on 22 September 1979 was a nuclear explosion”. Afterwards, this incident time was referred frequently. Although reliability of the “bhangmeters” was in question elsewhere, it seemed to have been taken for granted that the VELA satellite clock (more precisely the bhangmeter clock) was correctly synchronized with UT. However, there is almost no declassified supporting data on this incident time of 0100 UT. To have persuasive explanation of this event time, bhangmeter signals should be declassified on the satellite-UT time frame.
Characteristic features of the incident from hydro-acoustic data analyzed by the Naval Research Laboratory are surprisingly consistent with those from the Syowa seismographic records, as described in section 3. However, there was a discrepancy of ~ 14 hours between the two estimated origin times. I cannot explain logically this time discrepancy, because declassified MORD DocID 1108246 document are still full of masked portions. Original hydrophone time-series variation data on the UT time base are essentially required to solve this mystery.
I was a field geophysicist and engaged in Antarctic research over 30 years, and always concerned about the operational/logistic feasibility. As correctly pointed out in the National Security Archive Electronic Briefing Book No. 570, Posted December 8, 2016, edited by William Burr and Avner Cohen, Document 10: Memorandums for the Files by Ross E. Cowey, director of Strategic Affairs, Office of Intelligence and Research, 10 October 1979, Secret, “it was unusual to stage a test at night”. I would say “no experts would do such a risky operation in darkness of late winter/early autumn”.
Acknowledgment
I thank Ms. Tomoe Ando, Earth Science Group of National Institute of Polar Research for helping me to prepare the manuscript.
References
Hagiwara, T., 1958. A note on the theory of the electromagnetic seismograph. Bull. Earthq. Res. Inst., 36, 139-164.
Kaminuma, K., 1981. Seismological Bulletin of Syowa Station, Antarctica, 1979. JARE Data
Reports No. 59 (Seismology 14), Natl Inst. Polar Res., Tokyo, 34p. (ISSN 0075-3343)
Vanӗk, J., Zάtopek, A., Kάrnik, V., Kondorskaya, N.V., Riznichenko, Yu.V., Savarensky, Ye.F.,
Solov’ev, S.L., Shebalin, N.V., 1962. Standardization of magnitude scales. Bull.(Izvest.) Acad.
Sci. USSR, Geophys. Ser. 2, 108.
Wielandt, E., 1975. Generation of seismic waves by underwater explosions. Geophys. J. R. astr. Soc., 40, 421-439.
Titles of the declassified information about the Vela Incident were lengthy and do not follow the style of scientific papers. Although there are not listed in references, they are cited in the main text as faithfully as I can.
Appendix
One-day-long seismic records from 1108UT 22 September to 1030 UT 23 September of the three component HES seismographs (top E‒W, middle N‒S, bottom Z = up‒down). Running speed was 2 cm/min, and the minute mark appears as a level shift of 00 second. Thirty level shifts appear as white gaps in one line, and 48 lines with each spacing of 0.5 mm constitute one-day record on a 24‒mm wide and 62 cm‒long microfilm. Arrangement of 1/6 through 6/6 from left to right constitute five-to-six time enlarged traces of the original microfilms, which are archived in the geophysical data loboralory.
Arrangement microfilmes