2021.04.25 Units in the figures on this website are corrected.
2021.02.26 M-transform website is opened!!
2014.08.22 The first paper about M-transform was published online.

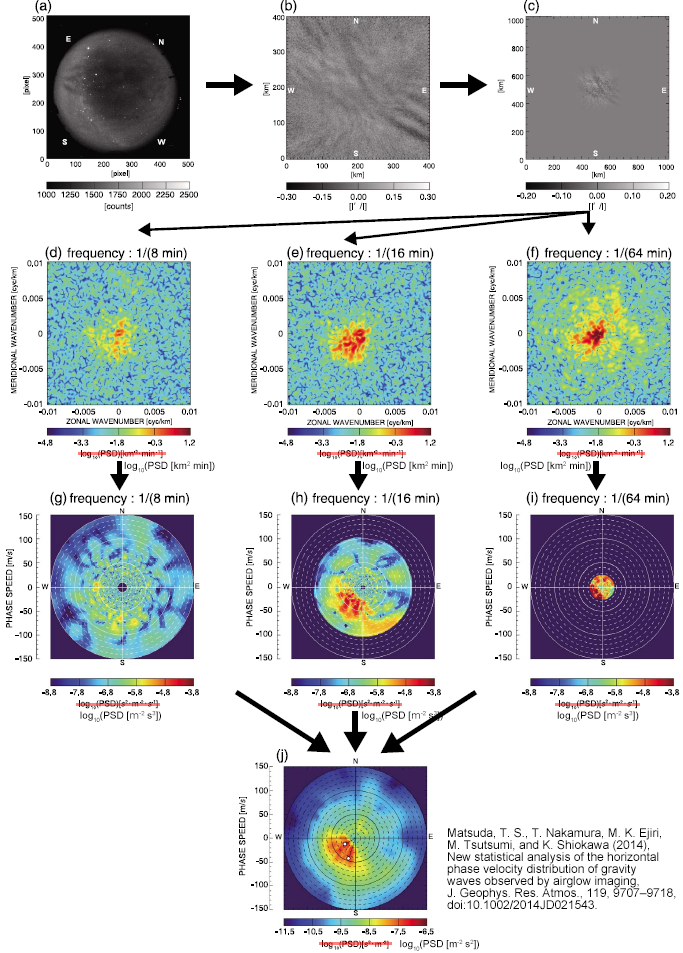
This method requires time series of airglow images in 3-D array format, which have been preprocessed to have fixed intervals of image pixels (dx, dy) and time (dt). These preprocessed images should be obtained through common airglow image preprocessing, that is, (1) star removal, (2) correction of the Van Rijhin effect if necessary, and (3) projection onto a geographical coordinate system in equal distances in latitudinal and longitudinal directions (e.g., Kubota et al., 2001; Suzuki et al., 2007). It is also recommended to normalize the airglow intensity values to compare the power spectral values of different datasets. For this purpose, ((I_raw - I_bg) / I_bg), where I is the image intensity of each pixel, should be used in the input array. Our M-transform code applies 2-D prewhitening to the images to reduce the contamination of higher wavenumbers with lower-wavenumber peaks of the red AGW spectrum. It also applies the 2-D Hanning window to reduce the harmonics of the window function in the horizontal direction (Coble et al., 1998). Matsuda et al.’s (2014) new method transforms the power spectrum density (PSD) in the wave number domain (k, l, w) to the phase velocity domain (vx , vy , w) based on the following equations:
vx = wk / (k^2 + l^2)
vy = wl / (k^2 + l^2)
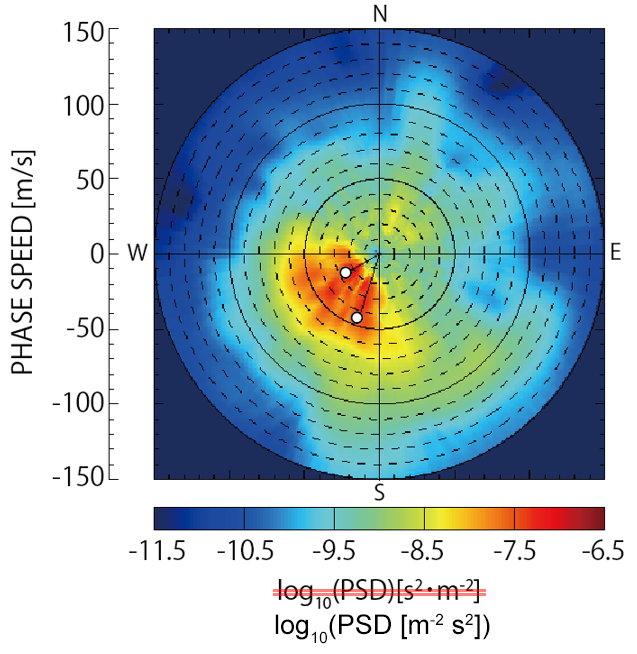
where vx and vy are the orthogonal projections of the phase velocity onto zonal and meridional axes, respectively. Note that x and y are not the phase velocities in the zonal or meridional directions or cross sections; w is the frequency; and k and l are the zonal and meridional wavenumbers, respectively. Finally, the phase velocity spectrum is integrated over the frequency and results in a 2-D phase velocity spectrum.
You can download the IDL code. Contact us for the ID and password.
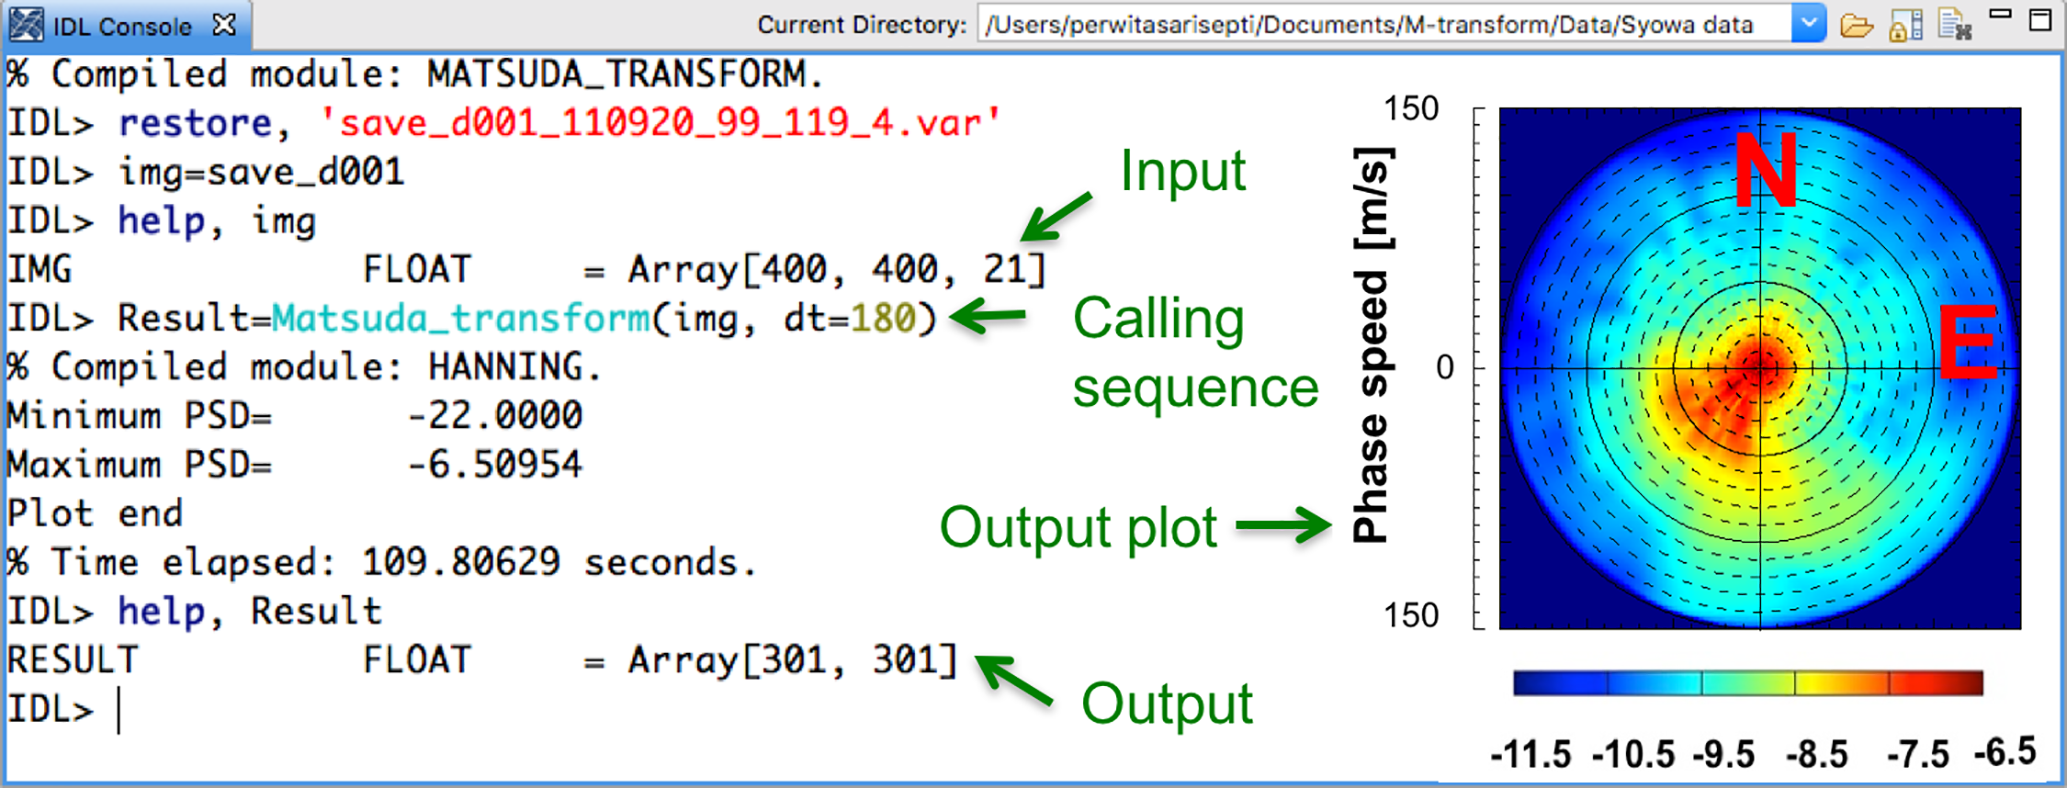
Example of how to use the Matsuda-transform (M-transform) program, showing the input, calling sequence, total calculation time, and output as 2-D phase velocity spectrum [Perwitasari et al., 2018]. See manual for more detail.
M-transform program is free software when used for academic non-commercial purpose; Modification of the code is not recommended. Should you need the modification at your side, do it at your own risk. In any case, you should acknowledge us in the acknowledgement when used in the publication. Acknowledgment should clearly state that M-transform software used has been developed by National Institute of Polar Research (NIPR), Japan.
We strongly encourage you to contact us for discussion before using the result of this software for any publications, in order to avoid misuse of the software or incorrect interpretation of the result.
Members who have developed M-transform and their affiliated organizations are not responsible for any damages arising from use of the software.
Septi Perwitasari (NICT) and Masaru Kogure (Kyushu Univ.)
- Matsuda, T. S., Nakamura, T., Ejiri, M. K., Tsutsumi, M., and Shiokawa, K.: New statistical analysis of the horizontal phase velocity distribution of gravity waves observed by airglow imaging, J. Geophys. Res.-Atmos., 119, 9707–9718, https://doi.org/10.1002/2014JD021543, 2014.
- Takeo, D., K. Shiokawa, H. Fujinami, Y. Otsuka, T. S. Matsuda, M. K. Ejiri, T. Nakamura, M. Yamamoto, Sixteen year variation of horizontal phase velocity and propagation direction of mesospheric and thermospheric waves in airglow images at Shigaraki, Japan, Journal of Geophysical Research: Space Physics, https://doi.org/10.1002/2017JA023919, 122(8), 8770 - 8780, 2017.
- Matsuda, Takashi S., Takuji Nakamura, Mitsumu K. Ejiri, Masaki Tsutsumi, Yoshihiro Tomikawa, Michael J. Taylor, Yucheng Zhao, P. -Dominique Pautet, Damian J. Murphy, Tracy Moffat-Griffin, Characteristics of mesospheric gravity waves over Antarctica observed by Antarctic Gravity Wave Instrument Network imagers using 3-D spectral analyses, Journal of Geophysical Research: Atmospheres, https://doi.org/10.1002/2016JD026217, 122(17), 8969 - 8981, 2017.
- Perwitasari, S., Nakamura, T., Kogure, M., Tomikawa, Y., Ejiri, M. K., and Shiokawa, K.: Comparison of gravity wave propagation directions observed by mesospheric airglow imaging at three different latitudes using the M-transform, Ann. Geophys., 36, 1597–1605, https://doi.org/10.5194/angeo-36-1597-2018, 2018.
- Tsuchiya, Satoshi, Kazuo Shiokawa, Hatsuki Fujinami, Yuichi Otsuka, Takuji Nakamura, Mamoru Yamamoto, Statistical Analysis of the Phase Velocity Distribution of Mesospheric and Ionospheric Waves Observed in Airglow Images Over a 16‐Year Period: Comparison Between Rikubetsu and Shigaraki, Japan, Journal of Geophysical Research: Space Physics, https://doi.org/10.1029/2018JA025585, 123, 8, (6930-6947), 2018.
- Tsuchiya, Satoshi, Kazuo Shiokawa, Hatsuki Fujinami, Yuichi Otsuka, Takuji Nakamura, Martin Connors, Ian Schofield, Boris Shevtsov, Igor Poddelsky, Three‐Dimensional Fourier Analysis of the Phase Velocity Distributions of Mesospheric and Ionospheric Waves Based on Airglow Images Collected Over 10 Years: Comparison of Magadan, Russia, and Athabasca, Canada, Journal of Geophysical Research: Space Physics, https://doi.org/10.1029/2019JA026783, 124, 10, (8110-8124), 2019.
- Tsuchiya, Satoshi, Kazuo Shiokawa, Yuichi Otsuka, Takuji Nakamura, Mamoru Yamamoto, Martin Connors, Ian Schofield, Boris Shevtsov, Igor Poddelsky, Wavenumber Spectra of Atmospheric Gravity Waves and Medium‐Scale Traveling Ionospheric Disturbances Based on More Than 10‐Year Airglow Images in Japan, Russia, and Canada, Journal of Geophysical Research: Space Physics, https://doi.org/10.1029/2019JA026807, 125, 3,, 2020.
- Kam, H., Song, I.-S., Kim, J.-H., Kim, Y. H., Song, B.-G., Nakamura, T., Tomikawa, Y., Kogure, M., Ejiri, M. K., Perwitasari, S., Tsutsumi, M., Kwak, Y.-S. Mesospheric short-period gravity waves in the Antarctic Peninsula observed in all-sky airglow images and their possible source locations. Journal of Geophysical Research: Atmospheres, 126, e2021JD035842. https://doi. org/10.1029/2021JD035842, 2021.
- Perwitasari, S., Takuji Nakamura, Takuya Tsugawa, Michi Nishioka, Yoshihiro Tomikawa, Mitsumu Ejiri, Masaru Kogure, Youichi Otsuka, Atuki Shinbori, Hidekatsu Jin, Chihiro Tao, Propagation directionanalyses of medium-scale travelingionospheric disturbances observedover North America with GPS-TECperturbation maps by three-dimensionalspectral analysis method. Journal ofGeophysical Research: Space Physics,127, e2020JA028791. https://doi.org/10.1029/2020JA028791, 2022.
- Kogure, M., T. Nakamura, D. J. Murphy, M. J. Taylor, Y. Zhao, P.-D. Pautet, M. Tsutsumi, Y. Tomikawa, M. K. Ejiri, and T. Nishiyama, Characteristics of gravity wave horizontal phase velocity spectra in the mesosphere over the Antarctic stations, Syowa and Davis, J. Geophys. Res. Atmos., 128, e2022JD037751, 2023.
- Tsuboi, T., Shiokawa, K., Otsuka, Y.,Fujinami, H., & Nakamura, T., Statistical analysis of the horizontal phasevelocity distribution of atmosphericgravity waves and Medium-scale travelingionospheric disturbances in airglowimages over Sata (31.0°N, 130.7°E), Japan, Journal of Geophysical Research:Space Physics, 128, e2023JA031600.https://doi.org/10.1029/2023JA031600, 2023.
- Giongo, G. A., Wrasse, C. M., Pautet, P.-D., Bageston, J. V., Nyassor, P. K., Figueiredo, C. A. O. B., Bilibio, A. V., Gobbi, D., and Takahashi, H., Medium-scale gravity waves observational methodology for antarctic airglow observations, EGUsphere [preprint], https://doi.org/10.5194/egusphere-2024-3344, 2024.
- Yuan, T., Pautet, P.-D., Zia, K., Zhao, Y., & Taylor, M. J., The variations ofgravity wave activities during theformation of the large horizontal windshears in the static state lowerthermosphere. Earth and Space Science,11, e2023EA003296. https://doi.org/10.1029/2023EA003296, 2024.